
Market news:
In the early Asian session on Wednesday (July 16), spot gold fluctuated slightly higher and is currently trading around $3,330/ounce. After the release of US inflation data, the market's focus shifted from macro data and interest rate prospects to policy risks again. The US dollar index strengthened by 0.6%, which also exacerbated the short-term pressure on London gold prices!
Although gold prices have shown a downward trend in the short term, market sentiment has not completely turned to pessimism. The uncertainty of tariff policies may provide support for gold prices. We are still optimistic about the long-term trend of gold, and the market's attention to tariffs will drive international gold prices to rebound in the future.
Next, investors will focus on the US Producer Price Index (PPI) to be released on Wednesday, as well as speeches by Fed officials to assess policy trends. Many institutions believe that in the context of intensified global policy games and increased volatility of the US dollar, the importance of international gold as a safe-haven and anti-inflation asset is still increasing.
Technical review:
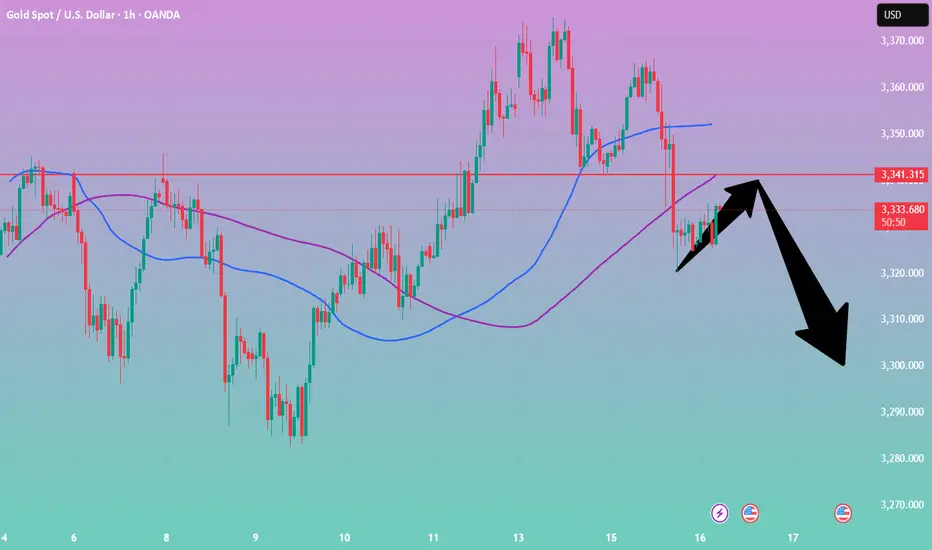
Gold hit a high of 3,366 yesterday and was blocked and fell back. It broke down to 3,320 during the US trading session and closed with a long shadow on the daily line. Today, the trend is to continue to fluctuate, and there should not be much room below. The current support level is near the daily MA5 and the middle track. The next step is still the focus. If you want to rise, you can't go down here. If you go down, you will continue to sweep back to 3320 and 3300!
The daily line maintains a continuous negative structure. The further strengthening of the US index puts gold and silver under downward pressure. The gold price on the daily chart returns to below the MA10 daily moving average, the New York closing plus the 5/7-day moving average, the RSI indicator middle axis is flat, and the price is running in the middle and lower track of the Bollinger band. The four-hour chart and the hourly chart moving average cross open downward, the RSI indicator runs below the middle axis, and the Bollinger band hourly chart opens downward and runs in the middle and lower track of the price. The gold trading idea remains unchanged with the high-price selling layout as the main layout, and the low-price buying is auxiliary.
Today's analysis:
Gold has been very weak in the past two days, and it has been going up and down. Gold finally fell as expected yesterday. Gold won three consecutive victories yesterday. Gold bought at a high level and failed. Gold will be sold again next. Gold rebounded in the Asian session and continued to sell.
Gold's 1-hour moving average has also begun to turn downward from a high position. If the gold's 1-hour moving average forms a dead cross downward, the downward momentum of gold will increase, and gold still has room to fall. Gold fell below the previous double bottom support of 3346 in the US market yesterday. Now gold's 3346 short-term has begun to turn into resistance. Gold is under pressure at 3346 in the Asian market and continues to sell at high prices.
Operation ideas:
Short-term gold 3310-3313 buy, stop loss 3302, target 3340-3360;
Short-term gold 3346-3349 sell, stop loss 3358, target 3320-3300;
Key points:
First support level: 3320, second support level: 3308, third support level: 3292
First resistance level: 3346, second resistance level: 3360, third resistance level: 3376
In the early Asian session on Wednesday (July 16), spot gold fluctuated slightly higher and is currently trading around $3,330/ounce. After the release of US inflation data, the market's focus shifted from macro data and interest rate prospects to policy risks again. The US dollar index strengthened by 0.6%, which also exacerbated the short-term pressure on London gold prices!
Although gold prices have shown a downward trend in the short term, market sentiment has not completely turned to pessimism. The uncertainty of tariff policies may provide support for gold prices. We are still optimistic about the long-term trend of gold, and the market's attention to tariffs will drive international gold prices to rebound in the future.
Next, investors will focus on the US Producer Price Index (PPI) to be released on Wednesday, as well as speeches by Fed officials to assess policy trends. Many institutions believe that in the context of intensified global policy games and increased volatility of the US dollar, the importance of international gold as a safe-haven and anti-inflation asset is still increasing.
Technical review:
Gold hit a high of 3,366 yesterday and was blocked and fell back. It broke down to 3,320 during the US trading session and closed with a long shadow on the daily line. Today, the trend is to continue to fluctuate, and there should not be much room below. The current support level is near the daily MA5 and the middle track. The next step is still the focus. If you want to rise, you can't go down here. If you go down, you will continue to sweep back to 3320 and 3300!
The daily line maintains a continuous negative structure. The further strengthening of the US index puts gold and silver under downward pressure. The gold price on the daily chart returns to below the MA10 daily moving average, the New York closing plus the 5/7-day moving average, the RSI indicator middle axis is flat, and the price is running in the middle and lower track of the Bollinger band. The four-hour chart and the hourly chart moving average cross open downward, the RSI indicator runs below the middle axis, and the Bollinger band hourly chart opens downward and runs in the middle and lower track of the price. The gold trading idea remains unchanged with the high-price selling layout as the main layout, and the low-price buying is auxiliary.
Today's analysis:
Gold has been very weak in the past two days, and it has been going up and down. Gold finally fell as expected yesterday. Gold won three consecutive victories yesterday. Gold bought at a high level and failed. Gold will be sold again next. Gold rebounded in the Asian session and continued to sell.
Gold's 1-hour moving average has also begun to turn downward from a high position. If the gold's 1-hour moving average forms a dead cross downward, the downward momentum of gold will increase, and gold still has room to fall. Gold fell below the previous double bottom support of 3346 in the US market yesterday. Now gold's 3346 short-term has begun to turn into resistance. Gold is under pressure at 3346 in the Asian market and continues to sell at high prices.
Operation ideas:
Short-term gold 3310-3313 buy, stop loss 3302, target 3340-3360;
Short-term gold 3346-3349 sell, stop loss 3358, target 3320-3300;
Key points:
First support level: 3320, second support level: 3308, third support level: 3292
First resistance level: 3346, second resistance level: 3360, third resistance level: 3376

Wyłączenie odpowiedzialności
Informacje i publikacje nie stanowią i nie powinny być traktowane jako porady finansowe, inwestycyjne, tradingowe ani jakiekolwiek inne rekomendacje dostarczane lub zatwierdzone przez TradingView. Więcej informacji znajduje się w Warunkach użytkowania.
Wyłączenie odpowiedzialności
Informacje i publikacje nie stanowią i nie powinny być traktowane jako porady finansowe, inwestycyjne, tradingowe ani jakiekolwiek inne rekomendacje dostarczane lub zatwierdzone przez TradingView. Więcej informacji znajduje się w Warunkach użytkowania.