
The global gold market enters the trading week of May 6 to May 11, 2026, positioned at a historic inflection point. Driven by a volatile convergence of geopolitical conflict, shifting interest rate expectations, and an unprecedented structural shift in institutional demand, the yellow metal has navigated a period of extreme fluctuations.
Following a swift correction from historical peaks, XAU/USD has entered a stabilization phase, seeking to establish a new consolidation range. As the market digests the fallout from the ongoing conflict in the Middle East and the resulting disruption in global energy supplies, price action has transitioned from a pure momentum play into a high-stakes battle between inflationary pressures and the rising opportunity cost of non-yielding assets.
GOLD MARKET FUNDAMENTALS: GEOPOLITICAL SHOCKS
The primary narrative driving gold prices as the week commences is the persistent military hostilities in the Middle East. The conflict has entered a critical stage where the threat of a full-scale ground invasion and the blockade of the Strait of Hormuz have injected a substantial risk premium into both energy and precious metals.
The Strait of Hormuz and Energy-Driven Inflation:
Disruptions to shipping through the Strait of Hormuz have pushed Brent crude oil above $110 per barrel. This "Hormuz premium" is now a permanent feature of market pricing. While liquidity needs often outweigh safe-haven demand in the early stages of such shocks, the role of gold as a store of wealth tends to reassert itself as trust in traditional debt markets weakens.
Geopolitical Catalyst Overview:
Middle East Conflict: Operation Epic Fury Ongoing (High Volatility / Safe-Haven Demand)
Strait of Hormuz: Partial Blockade (Bullish for Energy and Gold Premium)
U.S. Trade Policy: New Tariff Threats on EU/Canada (Bullish for Diversification Assets)
Iran Deadline: May 6 Negotiation Window (Critical Pivot Point for Oil Prices)
U.S. Credit Rating: Downgraded to Aa1 by Moody's (Long-term Structural Support for Gold)
CENTRAL BANK ACCUMULATION AND DE-DOLLARIZATION
A significant structural floor under gold prices has been established by unprecedented central bank accumulation. While buying slowed slightly in early 2026, the long-term trend remains firmly bullish as nations seek alternatives to the dollar-dominated financial system.
Key Institutional Moves:
Poland (NBP): Added 20 tonnes in February 2026, bringing the total to 570 tonnes.
China (PBOC): Reported its 16th consecutive month of purchases.
Uzbekistan & India: Continued growth in reserves to mitigate financial sanction risks.
TECHNICAL ANALYSIS OF XAU/USD
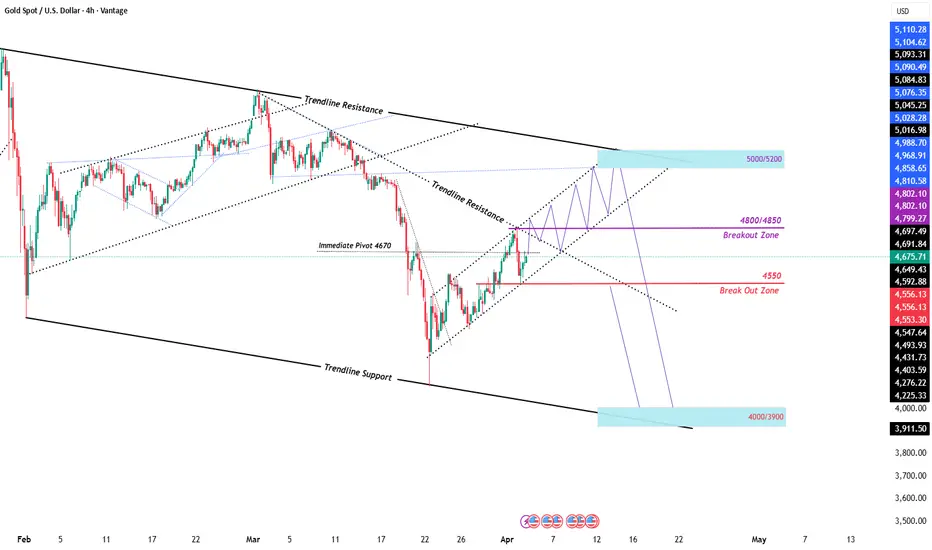
Technically, gold is navigating a critical "Decision Zone". Following the sharp correction from all-time highs above $5,500, the market is attempting to reclaim broken support levels.
Key Support and Resistance Levels (May 6–11):
Immediate Pivot Point ($4,670–$4,680): Axis for short-term direction. Consolidation above this suggests a base for recovery.
Immediate Supply Zone ($4,720–$4,760): Resistance area. A daily close above $4,760 is required to challenge the 50-day EMA.
Major Structural Resistance ($4,800–$4,850): Confluence of the 50-day EMA and the 61.8% Fibonacci retracement.
Psychological Ceiling ($5,000): Reclaiming this level would invalidate the medium-term bearish outlook.
Critical Decision Zone ($4,630–$4,631): Confluence of the 0.382 Fibonacci level and the rising trendline.
Primary Support Floor ($4,400–$4,500): February lows. A break below $4,400 opens the door for the 200-day EMA near $4,124.
Technical Indicators:
RSI (14): Daily at 54.10 (Neutral / Improving)
MACD (12, 26): 4-Hour near Zero Line (Indecision / Ranging)
EMA (20): Daily $4,735 (Dynamic Resistance)
EMA (50): Daily $4,800 (Major Trend Barrier)
EMA (200): Daily $4,124 (Long-term Value Floor)
THE FEDERAL RESERVE AND ECONOMIC DATA FORECAST
The primary headwind for gold is the rise in real yields and the rapid erosion of rate-cut expectations. With the U.S. economy showing resilience, the "Higher-for-Longer" narrative remains dominant.
Economic Calendar: High-Impact Events (GMT):
May 6 : US ISM Services PMI (Forecast: 55.0)
May 8 : RBNZ Rate Decision (Forecast: 2.25% Hold)
May 8 : FOMC Meeting Minutes
May 10 : US CPI YoY (Forecast: 2.5%)
May 10 : UoM Consumer Sentiment (Forecast: 54.5)
TRADING STRATEGY AND RISK MANAGEMENT
Gold has transitioned into a volatility-driven medium. Traders should expect daily ranges of $150 to $250.
Smart Money Concepts: Institutional order flow indicates liquidity-seeking behavior below March/April lows. Watch for "liquidity sweeps" below $4,600.
Gold-Silver Ratio (GSR): The ratio has compressed to a 15-year low near 59:1, suggesting silver outperformance but potential short-term exhaustion in metals.
Position Sizing: Because the current $4,600+ price level carries a higher notional value, position sizes must be adjusted to keep total risk per trade below 1-2%.
Stop Losses: Utilize the Average True Range (ATR) to set stops. With ATR near $120, tight stops are risky.
FAQ SECTION
Q: Why is gold falling despite the war?
A: Initial stages of conflict often trigger liquidity liquidation. High oil prices fuel inflation, leading the Fed to maintain high rates, which increases the opportunity cost of holding gold.
Q: Best time to trade XAU/USD this week?
A: Volatility peaks during the London/New York overlap (13:00 to 17:00 GMT). Friday's US CPI release will be critical.
Q: Is the gold bull run over for 2026?
A: Major institutions remain bullish long-term, with targets ranging from $5,400 to $6,300 by year-end, citing central bank buying.
Disclaimer: This analysis is for educational purposes only and does not constitute financial advice.
Following a swift correction from historical peaks, XAU/USD has entered a stabilization phase, seeking to establish a new consolidation range. As the market digests the fallout from the ongoing conflict in the Middle East and the resulting disruption in global energy supplies, price action has transitioned from a pure momentum play into a high-stakes battle between inflationary pressures and the rising opportunity cost of non-yielding assets.
GOLD MARKET FUNDAMENTALS: GEOPOLITICAL SHOCKS
The primary narrative driving gold prices as the week commences is the persistent military hostilities in the Middle East. The conflict has entered a critical stage where the threat of a full-scale ground invasion and the blockade of the Strait of Hormuz have injected a substantial risk premium into both energy and precious metals.
The Strait of Hormuz and Energy-Driven Inflation:
Disruptions to shipping through the Strait of Hormuz have pushed Brent crude oil above $110 per barrel. This "Hormuz premium" is now a permanent feature of market pricing. While liquidity needs often outweigh safe-haven demand in the early stages of such shocks, the role of gold as a store of wealth tends to reassert itself as trust in traditional debt markets weakens.
Geopolitical Catalyst Overview:
Middle East Conflict: Operation Epic Fury Ongoing (High Volatility / Safe-Haven Demand)
Strait of Hormuz: Partial Blockade (Bullish for Energy and Gold Premium)
U.S. Trade Policy: New Tariff Threats on EU/Canada (Bullish for Diversification Assets)
Iran Deadline: May 6 Negotiation Window (Critical Pivot Point for Oil Prices)
U.S. Credit Rating: Downgraded to Aa1 by Moody's (Long-term Structural Support for Gold)
CENTRAL BANK ACCUMULATION AND DE-DOLLARIZATION
A significant structural floor under gold prices has been established by unprecedented central bank accumulation. While buying slowed slightly in early 2026, the long-term trend remains firmly bullish as nations seek alternatives to the dollar-dominated financial system.
Key Institutional Moves:
Poland (NBP): Added 20 tonnes in February 2026, bringing the total to 570 tonnes.
China (PBOC): Reported its 16th consecutive month of purchases.
Uzbekistan & India: Continued growth in reserves to mitigate financial sanction risks.
TECHNICAL ANALYSIS OF XAU/USD
Technically, gold is navigating a critical "Decision Zone". Following the sharp correction from all-time highs above $5,500, the market is attempting to reclaim broken support levels.
Key Support and Resistance Levels (May 6–11):
Immediate Pivot Point ($4,670–$4,680): Axis for short-term direction. Consolidation above this suggests a base for recovery.
Immediate Supply Zone ($4,720–$4,760): Resistance area. A daily close above $4,760 is required to challenge the 50-day EMA.
Major Structural Resistance ($4,800–$4,850): Confluence of the 50-day EMA and the 61.8% Fibonacci retracement.
Psychological Ceiling ($5,000): Reclaiming this level would invalidate the medium-term bearish outlook.
Critical Decision Zone ($4,630–$4,631): Confluence of the 0.382 Fibonacci level and the rising trendline.
Primary Support Floor ($4,400–$4,500): February lows. A break below $4,400 opens the door for the 200-day EMA near $4,124.
Technical Indicators:
RSI (14): Daily at 54.10 (Neutral / Improving)
MACD (12, 26): 4-Hour near Zero Line (Indecision / Ranging)
EMA (20): Daily $4,735 (Dynamic Resistance)
EMA (50): Daily $4,800 (Major Trend Barrier)
EMA (200): Daily $4,124 (Long-term Value Floor)
THE FEDERAL RESERVE AND ECONOMIC DATA FORECAST
The primary headwind for gold is the rise in real yields and the rapid erosion of rate-cut expectations. With the U.S. economy showing resilience, the "Higher-for-Longer" narrative remains dominant.
Economic Calendar: High-Impact Events (GMT):
May 6 : US ISM Services PMI (Forecast: 55.0)
May 8 : RBNZ Rate Decision (Forecast: 2.25% Hold)
May 8 : FOMC Meeting Minutes
May 10 : US CPI YoY (Forecast: 2.5%)
May 10 : UoM Consumer Sentiment (Forecast: 54.5)
TRADING STRATEGY AND RISK MANAGEMENT
Gold has transitioned into a volatility-driven medium. Traders should expect daily ranges of $150 to $250.
Smart Money Concepts: Institutional order flow indicates liquidity-seeking behavior below March/April lows. Watch for "liquidity sweeps" below $4,600.
Gold-Silver Ratio (GSR): The ratio has compressed to a 15-year low near 59:1, suggesting silver outperformance but potential short-term exhaustion in metals.
Position Sizing: Because the current $4,600+ price level carries a higher notional value, position sizes must be adjusted to keep total risk per trade below 1-2%.
Stop Losses: Utilize the Average True Range (ATR) to set stops. With ATR near $120, tight stops are risky.
FAQ SECTION
Q: Why is gold falling despite the war?
A: Initial stages of conflict often trigger liquidity liquidation. High oil prices fuel inflation, leading the Fed to maintain high rates, which increases the opportunity cost of holding gold.
Q: Best time to trade XAU/USD this week?
A: Volatility peaks during the London/New York overlap (13:00 to 17:00 GMT). Friday's US CPI release will be critical.
Q: Is the gold bull run over for 2026?
A: Major institutions remain bullish long-term, with targets ranging from $5,400 to $6,300 by year-end, citing central bank buying.
Disclaimer: This analysis is for educational purposes only and does not constitute financial advice.

Forex Signals:
Youtube:
youtube.com/channel/UCMRAU6KDZOro-KmFFSKlfYA
Linkedin:
linkedin.com/company/investor-tipster
Website:
investortipster.com/
Youtube:
youtube.com/channel/UCMRAU6KDZOro-KmFFSKlfYA
Linkedin:
linkedin.com/company/investor-tipster
Website:
investortipster.com/
Powiązane publikacje
Wyłączenie odpowiedzialności
Informacje i publikacje nie stanowią i nie powinny być traktowane jako porady finansowe, inwestycyjne, tradingowe ani jakiekolwiek inne rekomendacje dostarczane lub zatwierdzone przez TradingView. Więcej informacji znajduje się w Warunkach użytkowania.
Forex Signals:
Youtube:
youtube.com/channel/UCMRAU6KDZOro-KmFFSKlfYA
Linkedin:
linkedin.com/company/investor-tipster
Website:
investortipster.com/
Youtube:
youtube.com/channel/UCMRAU6KDZOro-KmFFSKlfYA
Linkedin:
linkedin.com/company/investor-tipster
Website:
investortipster.com/
Powiązane publikacje
Wyłączenie odpowiedzialności
Informacje i publikacje nie stanowią i nie powinny być traktowane jako porady finansowe, inwestycyjne, tradingowe ani jakiekolwiek inne rekomendacje dostarczane lub zatwierdzone przez TradingView. Więcej informacji znajduje się w Warunkach użytkowania.