
Gold – Testing the strength of the bullish wave structure
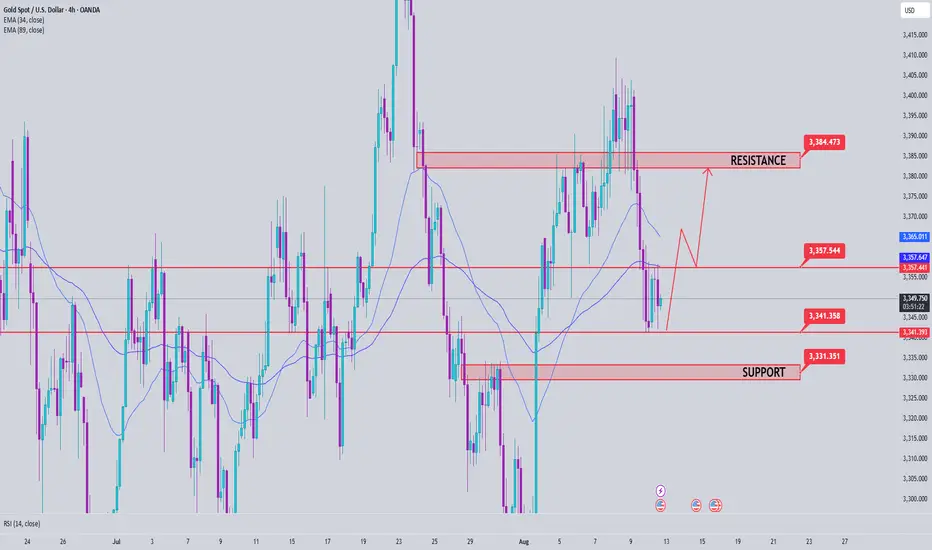
Today's session, gold prices are fluctuating in the Fibonacci 0.5 – 0.618 zone, raising the question: is the current uptrend still strong enough to sustain?
Previously, a strong increase from 3282 to 3406 completed wave 3. Currently, the downward pressure at the beginning of the week is considered a correction phase in wave 4.
The 3330 zone plays a "key" role in the bullish wave structure. If this level is broken, the market may end the uptrend and head towards the previous historical highs (ATH).
Trading strategy
BUY when there is a clear buying signal at 3330
BUY when the candle closes above 3357 (Fibonacci 0.618)
🎯 Target: 3383 – beyond 3431
Today's session, gold prices are fluctuating in the Fibonacci 0.5 – 0.618 zone, raising the question: is the current uptrend still strong enough to sustain?
Previously, a strong increase from 3282 to 3406 completed wave 3. Currently, the downward pressure at the beginning of the week is considered a correction phase in wave 4.
The 3330 zone plays a "key" role in the bullish wave structure. If this level is broken, the market may end the uptrend and head towards the previous historical highs (ATH).
Trading strategy
BUY when there is a clear buying signal at 3330
BUY when the candle closes above 3357 (Fibonacci 0.618)
🎯 Target: 3383 – beyond 3431

JOIN OUR FREE TELEGRAM GROUP t.me/tvstrading
MESSAGE US FOR VIP SIGNALS🏆 t.me/Leilani8597
MESSAGE US FOR VIP SIGNALS🏆 t.me/Leilani8597
Wyłączenie odpowiedzialności
Informacje i publikacje nie stanowią i nie powinny być traktowane jako porady finansowe, inwestycyjne, tradingowe ani jakiekolwiek inne rekomendacje dostarczane lub zatwierdzone przez TradingView. Więcej informacji znajduje się w Warunkach użytkowania.
JOIN OUR FREE TELEGRAM GROUP t.me/tvstrading
MESSAGE US FOR VIP SIGNALS🏆 t.me/Leilani8597
MESSAGE US FOR VIP SIGNALS🏆 t.me/Leilani8597
Wyłączenie odpowiedzialności
Informacje i publikacje nie stanowią i nie powinny być traktowane jako porady finansowe, inwestycyjne, tradingowe ani jakiekolwiek inne rekomendacje dostarczane lub zatwierdzone przez TradingView. Więcej informacji znajduje się w Warunkach użytkowania.