
Most traders see “2 ATR target” and immediately call the plan “2R.” That is not how R works.
R is defined by the distance between the planned entry and the logical structural invalidation. ATR is only a volatility-distance unit. They are related, but they are not interchangeable.
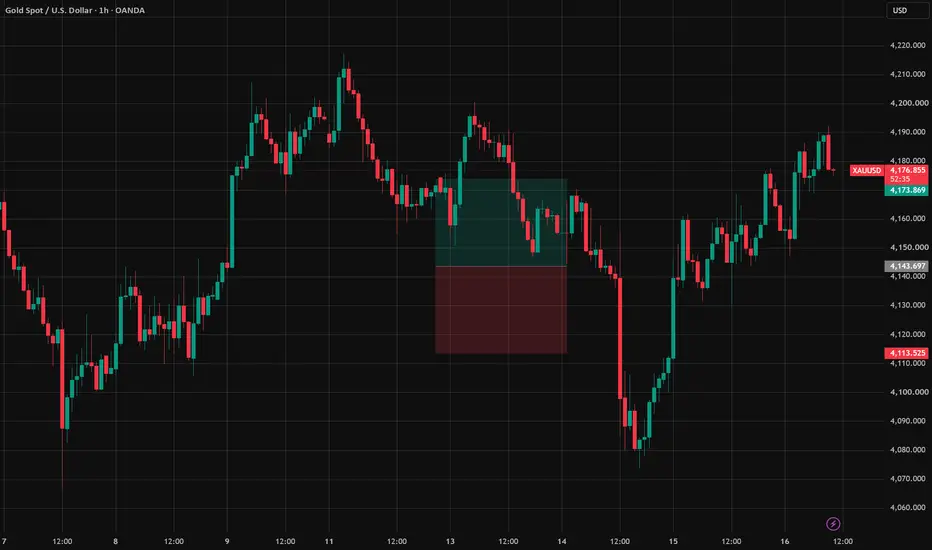
What the marked chart shows:
1. The entry is placed at the point where the setup would actually be considered.
2. The stop is placed beyond the structure that invalidates the idea—not at an arbitrary ATR distance.
3. The target is projected at 2 ATR from the entry.
4. When the two distances are compared, the target is only about 1.33 times the structural risk. That is approximately 1.33R, not 2R.
The important lesson is that the stop cannot be moved closer simply to manufacture a better reward-to-risk number. If the logical invalidation is too far away, the plan may be blocked. That is a valid result of the checklist.
GrowthX checklist connection:
• Trend: Is the higher-timeframe direction compatible?
• Structure/location: Is the entry near a meaningful, fresh or tested zone?
• Volatility: Is ATR expanding or contracting?
• Risk/room: Does the opposing level leave enough room after costs?
• Execution: Is position size calculated from the actual structural stop?
This is a worked planning example, not a buy or sell signal. The marked levels are an educational demonstration of the calculation. Always verify liquidity, spread, slippage, contract size and your own risk rules before considering any trade.
R is defined by the distance between the planned entry and the logical structural invalidation. ATR is only a volatility-distance unit. They are related, but they are not interchangeable.
What the marked chart shows:
1. The entry is placed at the point where the setup would actually be considered.
2. The stop is placed beyond the structure that invalidates the idea—not at an arbitrary ATR distance.
3. The target is projected at 2 ATR from the entry.
4. When the two distances are compared, the target is only about 1.33 times the structural risk. That is approximately 1.33R, not 2R.
The important lesson is that the stop cannot be moved closer simply to manufacture a better reward-to-risk number. If the logical invalidation is too far away, the plan may be blocked. That is a valid result of the checklist.
GrowthX checklist connection:
• Trend: Is the higher-timeframe direction compatible?
• Structure/location: Is the entry near a meaningful, fresh or tested zone?
• Volatility: Is ATR expanding or contracting?
• Risk/room: Does the opposing level leave enough room after costs?
• Execution: Is position size calculated from the actual structural stop?
This is a worked planning example, not a buy or sell signal. The marked levels are an educational demonstration of the calculation. Always verify liquidity, spread, slippage, contract size and your own risk rules before considering any trade.

Wyłączenie odpowiedzialności
Informacje i publikacje nie stanowią i nie powinny być traktowane jako porady finansowe, inwestycyjne, tradingowe ani jakiekolwiek inne rekomendacje dostarczane lub zatwierdzone przez TradingView. Więcej informacji znajduje się w Warunkach użytkowania.
Wyłączenie odpowiedzialności
Informacje i publikacje nie stanowią i nie powinny być traktowane jako porady finansowe, inwestycyjne, tradingowe ani jakiekolwiek inne rekomendacje dostarczane lub zatwierdzone przez TradingView. Więcej informacji znajduje się w Warunkach użytkowania.