
Lesson Focus: Chart Pattern Types (Theory)
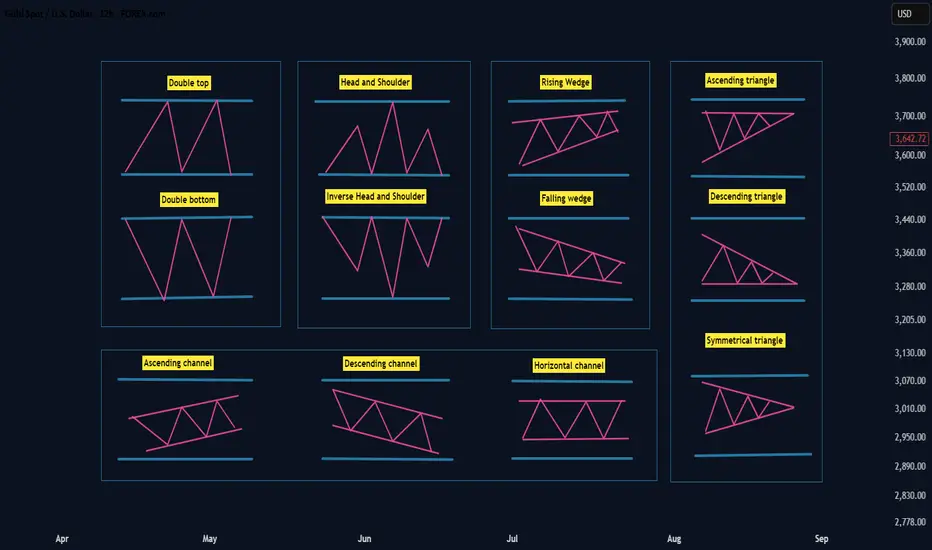
This educational chart explains what chart patterns are and how they are used as visual tools to understand market structure and historical price behavior.
Chart patterns do not predict or cause price movement.
They visually represent past interactions between buyers and sellers, helping us observe how market participation has previously behaved at certain price areas.
📌 WHAT IS A CHART PATTERN?
A chart pattern is a recurring price structure that forms as a result of:
• buying and selling pressure
• price compression or expansion
• repeated market reactions at specific price zones
Chart patterns are descriptive, not predictive.
They are used to study historical market behavior, not to provide trading instructions.
📊 TYPES OF CHART PATTERNS USED IN THIS EDUCATION
Double Top
A price structure where the market fails twice to continue higher, often reflecting increased selling pressure near a resistance area.
Double Bottom
A structure where price finds support twice at a similar level, showing repeated buying interest in the same price zone.
Rising Wedge
A contracting structure where price moves upward with decreasing momentum, illustrating gradual loss of bullish pressure.
Falling Wedge
A downward contracting structure that reflects weakening selling pressure over time.
Ascending Triangle
A pattern formed by rising lows and a horizontal resistance, showing increasing demand at higher price levels.
Descending Triangle
A pattern with falling highs and horizontal support, representing persistent selling pressure against a fixed price area.
Symmetrical Triangle
A balanced price compression where buying and selling pressure converge, indicating market indecision and reduced volatility.
Ascending Channel
A structured upward price movement within parallel boundaries, reflecting controlled bullish participation.
Descending Channel
A structured downward movement within parallel boundaries, showing controlled bearish participation.
Horizontal Channel
A range-bound structure where price moves sideways, representing temporary equilibrium between buyers and sellers.
🧩 KEY EDUCATIONAL CONCEPT
Candlesticks and chart patterns do not move price.
They reflect historical decisions made by market participants.
Market structure becomes clearer when we focus on:
• price interaction zones
• pressure buildup and release
• collective participant behavior
rather than treating patterns as standalone decision tools.
📘 SERIES NOTE
This lesson introduces the theoretical foundation of chart patterns.
Practical examples will follow in the next lessons.
If you find this educational series useful, you may follow the profile to continue exploring market structure concepts step by step.
ETHICAL & EDUCATIONAL NOTICE
This content is presented solely for educational and analytical purposes, based on historical price data.
It does not promote or encourage any specific trading method, financial instrument, gambling, leverage, margin usage, short selling, or interest-based activity.
Readers are encouraged to align any financial activity with their own ethical, legal, and religious principles.
⚠️ DISCLAIMER
This material is strictly educational and informational.
It does not constitute financial advice, investment recommendations, or trading instructions.
The author does not provide personalized guidance.
Any decisions made based on this content are the sole responsibility of the individual.
This educational chart explains what chart patterns are and how they are used as visual tools to understand market structure and historical price behavior.
Chart patterns do not predict or cause price movement.
They visually represent past interactions between buyers and sellers, helping us observe how market participation has previously behaved at certain price areas.
📌 WHAT IS A CHART PATTERN?
A chart pattern is a recurring price structure that forms as a result of:
• buying and selling pressure
• price compression or expansion
• repeated market reactions at specific price zones
Chart patterns are descriptive, not predictive.
They are used to study historical market behavior, not to provide trading instructions.
📊 TYPES OF CHART PATTERNS USED IN THIS EDUCATION
Double Top
A price structure where the market fails twice to continue higher, often reflecting increased selling pressure near a resistance area.
Double Bottom
A structure where price finds support twice at a similar level, showing repeated buying interest in the same price zone.
Rising Wedge
A contracting structure where price moves upward with decreasing momentum, illustrating gradual loss of bullish pressure.
Falling Wedge
A downward contracting structure that reflects weakening selling pressure over time.
Ascending Triangle
A pattern formed by rising lows and a horizontal resistance, showing increasing demand at higher price levels.
Descending Triangle
A pattern with falling highs and horizontal support, representing persistent selling pressure against a fixed price area.
Symmetrical Triangle
A balanced price compression where buying and selling pressure converge, indicating market indecision and reduced volatility.
Ascending Channel
A structured upward price movement within parallel boundaries, reflecting controlled bullish participation.
Descending Channel
A structured downward movement within parallel boundaries, showing controlled bearish participation.
Horizontal Channel
A range-bound structure where price moves sideways, representing temporary equilibrium between buyers and sellers.
🧩 KEY EDUCATIONAL CONCEPT
Candlesticks and chart patterns do not move price.
They reflect historical decisions made by market participants.
Market structure becomes clearer when we focus on:
• price interaction zones
• pressure buildup and release
• collective participant behavior
rather than treating patterns as standalone decision tools.
📘 SERIES NOTE
This lesson introduces the theoretical foundation of chart patterns.
Practical examples will follow in the next lessons.
If you find this educational series useful, you may follow the profile to continue exploring market structure concepts step by step.
ETHICAL & EDUCATIONAL NOTICE
This content is presented solely for educational and analytical purposes, based on historical price data.
It does not promote or encourage any specific trading method, financial instrument, gambling, leverage, margin usage, short selling, or interest-based activity.
Readers are encouraged to align any financial activity with their own ethical, legal, and religious principles.
⚠️ DISCLAIMER
This material is strictly educational and informational.
It does not constitute financial advice, investment recommendations, or trading instructions.
The author does not provide personalized guidance.
Any decisions made based on this content are the sole responsibility of the individual.

Powiązane publikacje
Wyłączenie odpowiedzialności
Informacje i publikacje nie stanowią i nie powinny być traktowane jako porady finansowe, inwestycyjne, tradingowe ani jakiekolwiek inne rekomendacje dostarczane lub zatwierdzone przez TradingView. Więcej informacji znajduje się w Warunkach użytkowania.
Powiązane publikacje
Wyłączenie odpowiedzialności
Informacje i publikacje nie stanowią i nie powinny być traktowane jako porady finansowe, inwestycyjne, tradingowe ani jakiekolwiek inne rekomendacje dostarczane lub zatwierdzone przez TradingView. Więcej informacji znajduje się w Warunkach użytkowania.