
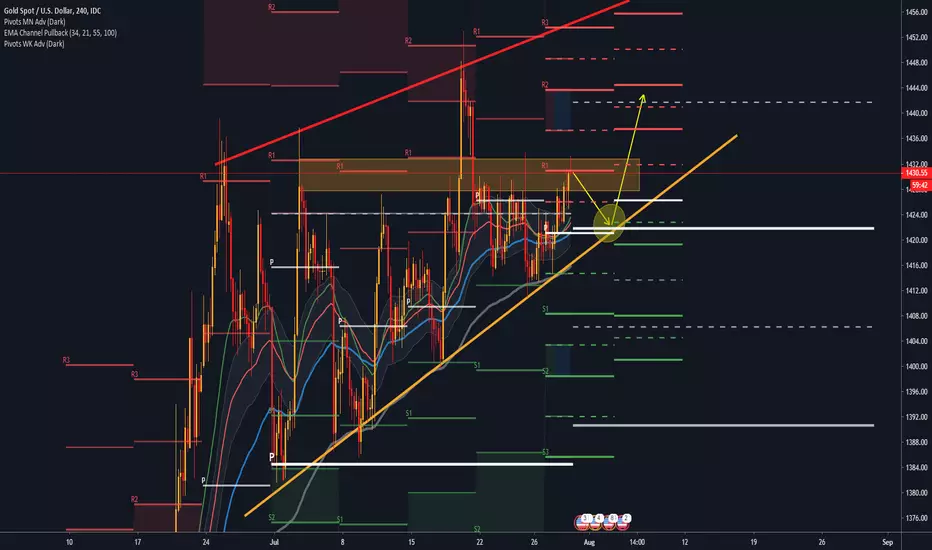
The lower (yellow) trendline coincides with the 100 EMA (gray) which indicates a strong area of support and this trendline also crosses with the next monthly Pivot-Point and also with this weeks Pivot-Point which makes this support zone super strong (I marked it with a yellow circle).
Next up, we have a strong resistance where the price is right now because the weekly R1 Pivot-Point coincides with the drawn resistance zone. If this resistance holds, then we have our trade set up:
Wait for pullback to lower (yellow) trendline and/or 100 EMA, then BUY (on August 1st/2nd/3rd).
Next up, we have a strong resistance where the price is right now because the weekly R1 Pivot-Point coincides with the drawn resistance zone. If this resistance holds, then we have our trade set up:
Wait for pullback to lower (yellow) trendline and/or 100 EMA, then BUY (on August 1st/2nd/3rd).
Uwaga
We did get the correction move downwards but pushed straight through downwards. This plan is no longer valid!Uwaga
If you are in a short trade, take profit and not just walk, RUN!
Wyłączenie odpowiedzialności
Informacje i publikacje nie stanowią i nie powinny być traktowane jako porady finansowe, inwestycyjne, tradingowe ani jakiekolwiek inne rekomendacje dostarczane lub zatwierdzone przez TradingView. Więcej informacji znajduje się w Warunkach użytkowania.
Wyłączenie odpowiedzialności
Informacje i publikacje nie stanowią i nie powinny być traktowane jako porady finansowe, inwestycyjne, tradingowe ani jakiekolwiek inne rekomendacje dostarczane lub zatwierdzone przez TradingView. Więcej informacji znajduje się w Warunkach użytkowania.