
📈
🔍 Market Structure & Key Observations
📉 Strong Rejection from Supply:
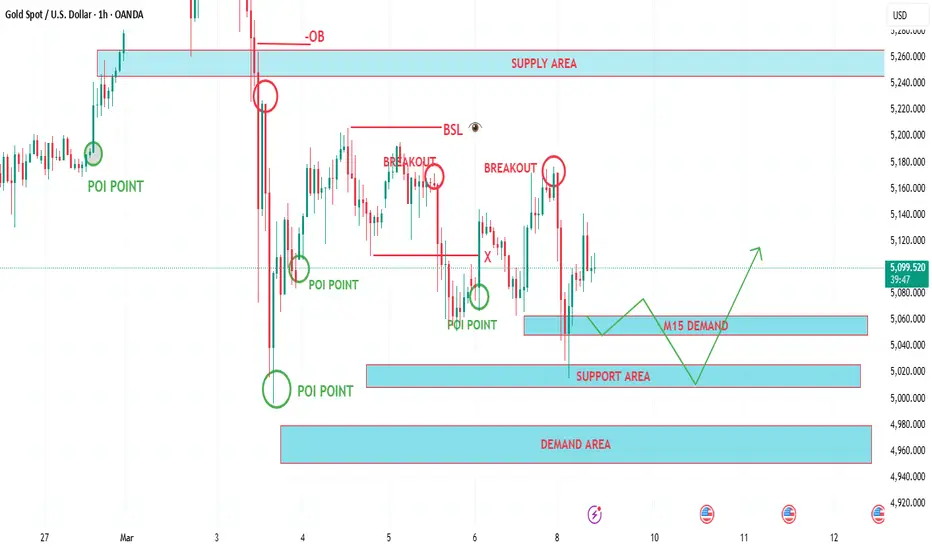
Gold previously faced a sharp rejection from the Supply Area 🔴 and the Order Block (OB), triggering a strong bearish move. This drop swept liquidity and pushed price toward deeper support zones.
🟢 Multiple POI Reactions:
Price has reacted several times from different Points of Interest (POI), showing that buyers are still defending key levels. These reactions indicate that the market is currently searching for a stable demand base.
👀 Buy-Side Liquidity (BSL):
Above the current price lies Buy-Side Liquidity (BSL), which often acts as a magnet for price once bullish momentum builds.
📦 Demand & Support Zones:
The chart highlights multiple support layers:
M15 Demand Zone around 5060
Major Support Area near 5020
Higher Timeframe Demand near 4960
These stacked demand zones increase the probability of a bullish reaction if price retraces into them.
⚡ Breakout Behavior:
Recent breakouts and failed breakouts show that the market is still consolidating and building liquidity before the next directional move.
🎯 Potential Scenario:
Price may retrace into the M15 Demand Zone or Support Area, collect liquidity, and then attempt a bullish move toward higher liquidity levels.
📊 Upside Target:
🎯 First Target: 5120 – Local resistance
🚀 Extended Target: 5180 – Buy-side liquidity zone
⚠️ Invalidation:
A strong breakdown below 5020 support could open the path toward the 4960 demand area.
🔍 Market Structure & Key Observations
📉 Strong Rejection from Supply:
Gold previously faced a sharp rejection from the Supply Area 🔴 and the Order Block (OB), triggering a strong bearish move. This drop swept liquidity and pushed price toward deeper support zones.
🟢 Multiple POI Reactions:
Price has reacted several times from different Points of Interest (POI), showing that buyers are still defending key levels. These reactions indicate that the market is currently searching for a stable demand base.
👀 Buy-Side Liquidity (BSL):
Above the current price lies Buy-Side Liquidity (BSL), which often acts as a magnet for price once bullish momentum builds.
📦 Demand & Support Zones:
The chart highlights multiple support layers:
M15 Demand Zone around 5060
Major Support Area near 5020
Higher Timeframe Demand near 4960
These stacked demand zones increase the probability of a bullish reaction if price retraces into them.
⚡ Breakout Behavior:
Recent breakouts and failed breakouts show that the market is still consolidating and building liquidity before the next directional move.
🎯 Potential Scenario:
Price may retrace into the M15 Demand Zone or Support Area, collect liquidity, and then attempt a bullish move toward higher liquidity levels.
📊 Upside Target:
🎯 First Target: 5120 – Local resistance
🚀 Extended Target: 5180 – Buy-side liquidity zone
⚠️ Invalidation:
A strong breakdown below 5020 support could open the path toward the 4960 demand area.
Transakcja zamknięta: osiągnięto wyznaczony cel
Market touched our zone and 1200+ smashed
join my telegram channel free
t.me/Pips_Profit_67
t.me/Pips_Profit_67
Daily 300+pips profits
weekly 2000+pips profit
High accuracy signals with double conformation
t.me/Pips_Profit_67
t.me/Pips_Profit_67
Daily 300+pips profits
weekly 2000+pips profit
High accuracy signals with double conformation
Wyłączenie odpowiedzialności
Informacje i publikacje nie stanowią i nie powinny być traktowane jako porady finansowe, inwestycyjne, tradingowe ani jakiekolwiek inne rekomendacje dostarczane lub zatwierdzone przez TradingView. Więcej informacji znajduje się w Warunkach użytkowania.
join my telegram channel free
t.me/Pips_Profit_67
t.me/Pips_Profit_67
Daily 300+pips profits
weekly 2000+pips profit
High accuracy signals with double conformation
t.me/Pips_Profit_67
t.me/Pips_Profit_67
Daily 300+pips profits
weekly 2000+pips profit
High accuracy signals with double conformation
Wyłączenie odpowiedzialności
Informacje i publikacje nie stanowią i nie powinny być traktowane jako porady finansowe, inwestycyjne, tradingowe ani jakiekolwiek inne rekomendacje dostarczane lub zatwierdzone przez TradingView. Więcej informacji znajduje się w Warunkach użytkowania.