
Credits: Kathy Lien
Graduating from NYU’s Stern School of Business at just 18, Kathy Lien has become one of the most respected experts in global macro and currencies, with more than two decades of trading experience.
Kathy began her career at JPMorgan Chase on the interbank FX desk before moving to the cross-markets proprietary trading group, trading FX, options, rates, bonds, equities, and futures.
In 2003, she launched DailyFX.com, building a leading team of analysts focused on making forex research accessible to traders. She later served as Director of Currency Research at Global Futures & Forex Ltd., and in 2011 co-founded BKTraders and BK Asset Management with Boris Schlossberg.
Kathy is also the Chief Strategist at PropTraderEdge.com, bringing her macro expertise to a new generation of prop traders.
Her market insights appear regularly on CNBC and in the Wall Street Journal, Reuters, Bloomberg, and Charles Schwab’s Mind of a Trader. She has authored several trader-favorite books, including “Day Trading and Swing Trading the Currency Market” and “Prop Trading Secrets.”
Known for blending fundamental analysis with precise chart reading, Kathy’s techniques form the foundation of BK’s trading strategies today.
What Is the Wyckoff Spring Trading Pattern?
Markets rarely move in straight lines. Instead, they spend long stretches trading sideways in what Wyckoff described as accumulation (when large players are building long positions) or distribution (when they are unloading them).
What is the Wyckoff Spring Trading Pattern?
Richard Wyckoff was a trader from the early 1900s who spent much of his career studying how markets really move. What made him different was that he was not only looking for quick profits, he wanted to understand the “why” behind price changes. Through decades of research, he discovered that price patterns often reflect the quiet actions of large players such as banks, funds, and institutions who accumulate positions before an uptrend or distribute them before a downtrend.
Today, his approach is called the Wyckoff Method, and at the heart of it is a simple but powerful truth: prices are driven by the balance between supply (selling) and demand (buying).
Accumulation and Distribution
Markets rarely move in straight lines. Instead, they spend long stretches trading sideways in what Wyckoff described as accumulation (when large players are building long positions) or distribution (when they are unloading them).
To most traders, these sideways ranges feel dull or confusing. But Wyckoff saw them as preparation for the next big move. If demand eventually outweighs supply, the range breaks upward. If supply takes control, it breaks downward.
Learning to recognize these ranges and where the balance of power is shifting is the foundation of Wyckoff’s work.
The Wyckoff Spring
One of Wyckoff’s most practical ideas is the Spring pattern. It happens like this:
Price dips below support. Traders watching that support level often panic and sell, thinking the market has broken down.
The breakdown does not hold. Instead of collapsing further, price quickly pops back above support.
The range continues. Price settles back into the trading range and often begins climbing higher.
This “spring” below support is essentially a test. If sellers cannot push the market lower, it means supply has been absorbed. Buyers quietly step in, and the path upward opens.
https://d1-invdn-com.investing.com/content/pic748c74a35e7fd308d2e9c8c7da5e81e3.jpg
Why It Matters
The Spring pattern is not magic. It does not show up every week, and when it does, it still requires judgment. But it can be a helpful reminder that markets are full of traps. A breakdown is not always the start of a bear trend. It can sometimes be the final shakeout before a rally.
For traders, the lesson is humility: wait for confirmation. If price breaks support but immediately springs back, it might not be weakness, it might be strength in disguise.
How to Apply It
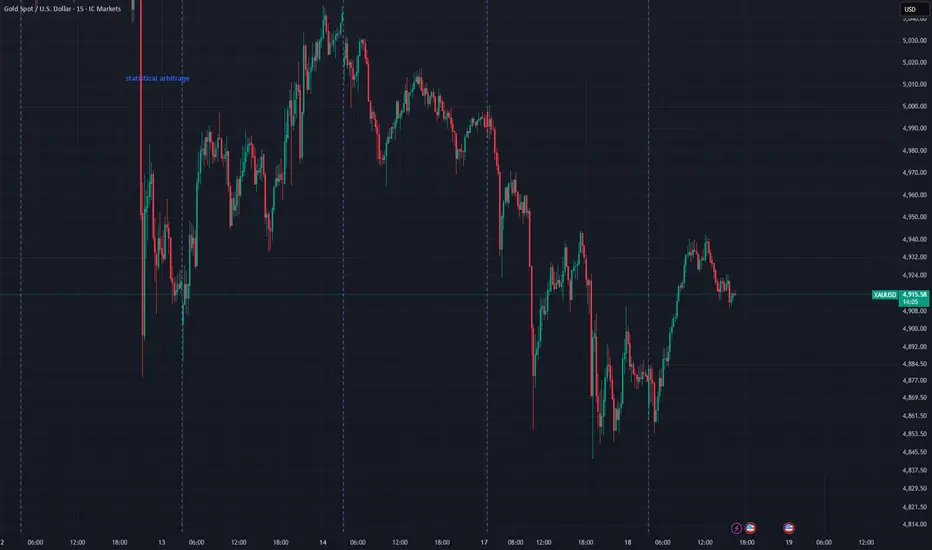
Wyckoff’s method can be used in any market, whether stocks, forex, futures, or crypto, and on any timeframe. Here’s a real-life example:
https://d1-invdn-com.investing.com/content/pic7d16eb43dcc396a078c848242c523173.jpg
Still, there are a few practical guidelines:
Look for context. A Spring is more meaningful after a prolonged downtrend or at a clear support level.
Use multiple timeframes. A Spring on a daily chart carries more weight than one on a one-minute chart.
Watch volume. Increased buying volume on the bounce is often a sign that demand is returning.
Combine signals. If a Spring aligns with other indicators such as oversold conditions or a major moving average, it deserves more attention.
The Bigger Picture
The Spring is only one part of Wyckoff’s larger framework. He also described the full cycle of accumulation, markup, distribution, and markdown. The goal is not to memorize patterns but to think in terms of who controls the market, buyers or sellers, and when that control shifts.
A Balanced View
It is easy to get caught up in trading patterns as if they are guaranteed signals. Wyckoff himself warned against this. No method removes uncertainty. Instead, his work offers a way to better read the story of the market and avoid being tricked by moves that seem obvious at first glance.
By studying patterns like the Spring, we can remind ourselves that markets are often designed to fool the majority. Staying patient, waiting for confirmation, and thinking about supply and demand can help us avoid common mistakes and trade with more confidence.
Which stock should you buy in your very next trade?
AI computing powers are changing the stock market. Investing.com's ProPicks AI includes dozens of winning stock portfolios chosen by our advanced AI.
Year to date, 2 out of 3 global portfolios are beating their benchmark indexes, with 88% in the green. Our flagship Tech Titans strategy doubled the S&P 500 within 18 months, including notable winners like Super Micro Computer (+185%) and AppLovin (+157%).
Graduating from NYU’s Stern School of Business at just 18, Kathy Lien has become one of the most respected experts in global macro and currencies, with more than two decades of trading experience.
Kathy began her career at JPMorgan Chase on the interbank FX desk before moving to the cross-markets proprietary trading group, trading FX, options, rates, bonds, equities, and futures.
In 2003, she launched DailyFX.com, building a leading team of analysts focused on making forex research accessible to traders. She later served as Director of Currency Research at Global Futures & Forex Ltd., and in 2011 co-founded BKTraders and BK Asset Management with Boris Schlossberg.
Kathy is also the Chief Strategist at PropTraderEdge.com, bringing her macro expertise to a new generation of prop traders.
Her market insights appear regularly on CNBC and in the Wall Street Journal, Reuters, Bloomberg, and Charles Schwab’s Mind of a Trader. She has authored several trader-favorite books, including “Day Trading and Swing Trading the Currency Market” and “Prop Trading Secrets.”
Known for blending fundamental analysis with precise chart reading, Kathy’s techniques form the foundation of BK’s trading strategies today.
What Is the Wyckoff Spring Trading Pattern?
Markets rarely move in straight lines. Instead, they spend long stretches trading sideways in what Wyckoff described as accumulation (when large players are building long positions) or distribution (when they are unloading them).
What is the Wyckoff Spring Trading Pattern?
Richard Wyckoff was a trader from the early 1900s who spent much of his career studying how markets really move. What made him different was that he was not only looking for quick profits, he wanted to understand the “why” behind price changes. Through decades of research, he discovered that price patterns often reflect the quiet actions of large players such as banks, funds, and institutions who accumulate positions before an uptrend or distribute them before a downtrend.
Today, his approach is called the Wyckoff Method, and at the heart of it is a simple but powerful truth: prices are driven by the balance between supply (selling) and demand (buying).
Accumulation and Distribution
Markets rarely move in straight lines. Instead, they spend long stretches trading sideways in what Wyckoff described as accumulation (when large players are building long positions) or distribution (when they are unloading them).
To most traders, these sideways ranges feel dull or confusing. But Wyckoff saw them as preparation for the next big move. If demand eventually outweighs supply, the range breaks upward. If supply takes control, it breaks downward.
Learning to recognize these ranges and where the balance of power is shifting is the foundation of Wyckoff’s work.
The Wyckoff Spring
One of Wyckoff’s most practical ideas is the Spring pattern. It happens like this:
Price dips below support. Traders watching that support level often panic and sell, thinking the market has broken down.
The breakdown does not hold. Instead of collapsing further, price quickly pops back above support.
The range continues. Price settles back into the trading range and often begins climbing higher.
This “spring” below support is essentially a test. If sellers cannot push the market lower, it means supply has been absorbed. Buyers quietly step in, and the path upward opens.
https://d1-invdn-com.investing.com/content/pic748c74a35e7fd308d2e9c8c7da5e81e3.jpg
Why It Matters
The Spring pattern is not magic. It does not show up every week, and when it does, it still requires judgment. But it can be a helpful reminder that markets are full of traps. A breakdown is not always the start of a bear trend. It can sometimes be the final shakeout before a rally.
For traders, the lesson is humility: wait for confirmation. If price breaks support but immediately springs back, it might not be weakness, it might be strength in disguise.
How to Apply It
Wyckoff’s method can be used in any market, whether stocks, forex, futures, or crypto, and on any timeframe. Here’s a real-life example:
https://d1-invdn-com.investing.com/content/pic7d16eb43dcc396a078c848242c523173.jpg
Still, there are a few practical guidelines:
Look for context. A Spring is more meaningful after a prolonged downtrend or at a clear support level.
Use multiple timeframes. A Spring on a daily chart carries more weight than one on a one-minute chart.
Watch volume. Increased buying volume on the bounce is often a sign that demand is returning.
Combine signals. If a Spring aligns with other indicators such as oversold conditions or a major moving average, it deserves more attention.
The Bigger Picture
The Spring is only one part of Wyckoff’s larger framework. He also described the full cycle of accumulation, markup, distribution, and markdown. The goal is not to memorize patterns but to think in terms of who controls the market, buyers or sellers, and when that control shifts.
A Balanced View
It is easy to get caught up in trading patterns as if they are guaranteed signals. Wyckoff himself warned against this. No method removes uncertainty. Instead, his work offers a way to better read the story of the market and avoid being tricked by moves that seem obvious at first glance.
By studying patterns like the Spring, we can remind ourselves that markets are often designed to fool the majority. Staying patient, waiting for confirmation, and thinking about supply and demand can help us avoid common mistakes and trade with more confidence.
Which stock should you buy in your very next trade?
AI computing powers are changing the stock market. Investing.com's ProPicks AI includes dozens of winning stock portfolios chosen by our advanced AI.
Year to date, 2 out of 3 global portfolios are beating their benchmark indexes, with 88% in the green. Our flagship Tech Titans strategy doubled the S&P 500 within 18 months, including notable winners like Super Micro Computer (+185%) and AppLovin (+157%).

Wyłączenie odpowiedzialności
Informacje i publikacje nie stanowią i nie powinny być traktowane jako porady finansowe, inwestycyjne, tradingowe ani jakiekolwiek inne rekomendacje dostarczane lub zatwierdzone przez TradingView. Więcej informacji znajduje się w Warunkach użytkowania.
Wyłączenie odpowiedzialności
Informacje i publikacje nie stanowią i nie powinny być traktowane jako porady finansowe, inwestycyjne, tradingowe ani jakiekolwiek inne rekomendacje dostarczane lub zatwierdzone przez TradingView. Więcej informacji znajduje się w Warunkach użytkowania.