
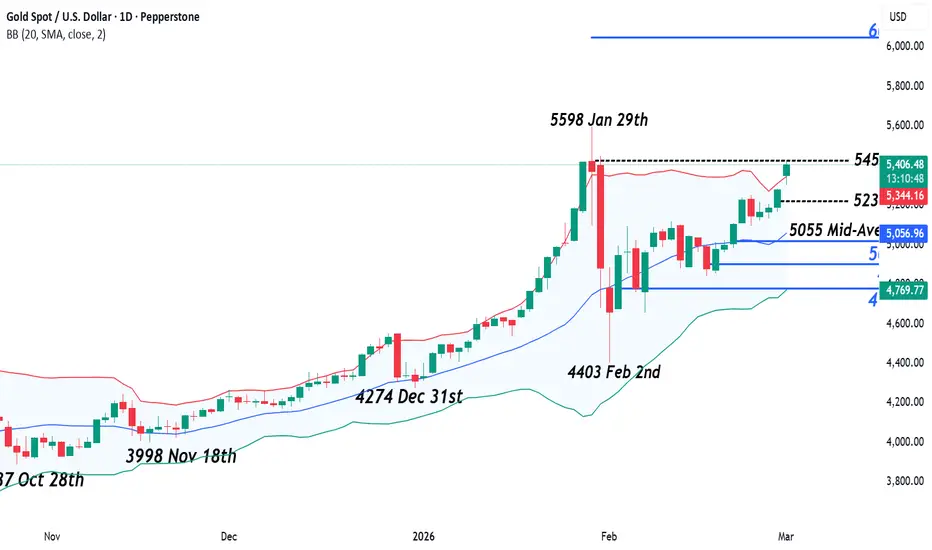
It could be argued that geopolitics weren’t considered a primary driver of Gold through much of February. The focus for traders was more on positioning, shifting Federal Reserve interest rate expectations and the jolt of uncertainty that followed the US Supreme Court’s decision to strike down President Trump’s reciprocal tariffs. This all combined to explain the sharp drop from all-time highs at 5598 on January 29th, to low at 4403 on February 2nd, and then just as importantly, the choppy rebound and subsequent firm hold above 5000 since February 20th.
However, geopolitics jumped to the forefront again on Friday after Bloomberg and other news agencies reported United Nations inspectors said Iran is conducting regular and unexplained activity at bombed uranium-enrichment sites, adding a major hurdle to on-going talks between US-Iran to agree a nuclear deal. This led Gold to spike 1.83% and close at a 1 month high of 5280. Gold is often seen as a safe haven during times of global upheaval or major geopolitical events, and traders were keen to add protection over the weekend.
It turns out that decision was a sound one, with the US and Israel carrying out combined strikes on targets across Iran on Saturday and Sunday, which was then followed by retaliatory strikes on US and Israeli bases in the Middle East region. The attacks on Tehran, the Iranian capital led to the death of the country’s Supreme Leader Ayatollah Khamenei and so far, officials have stated they will still not negotiate with the US. This all represents a major escalation and opens the possibility for a more extended conflict than initially anticipated. Perhaps unsurprisingly, Gold spiked another 2.5% this morning to fresh 1-month highs of 5419 in early trading (0730 GMT).
Whether Gold continues its recent up move to print new all-time highs above 5600, or falls back to lower levels may well depend on real time updates regarding how the fast moving situation in Iran develops over the next 48 hours, with traders sensitive to updates on the potential length of the conflict, support from US Congress for further escalation, and if the Iranian regime can maintain its rule of the country or eventually capitulates and opens the possibility of fresh negotiations.
Technical Update: Long Term Uptrend Resumption?
Gold strengthened into the weekend, with Friday’s close at the week’s upside extreme (5280), perhaps a sign of developing positive sentiment. Weekend events in Iran raised the likelihood of heightened volatility, and while the broader market impact remains to be seen this week, keeping key support and resistance levels in focus could be important for mapping out the next potential directional themes for Gold in the days ahead.
Potential Resistance Focus:
If the heightened geopolitical tensions escalate, traders might anticipate potential safe‑haven demand favouring further Gold strength. In that scenario, the first notable resistance may sit at 5451, a level which is equal to the January 30th high trade. A closing break above 5451 could reinforce upside momentum and open the door for attempts at additional price gains.

Gold’s ability to post successful closing breaks above 5451 could signal renewed momentum within the broader, still‑intact long‑term uptrend. Clearing that first resistance may open scope for tests of 5598, which is the January 29th all-time high. A break above 5598 could suggest the possibility of further price strength toward 6046, which is the 38.2% Fibonacci extension level.
Potential Support Focus:
Gold’s recent strength could face corrective pressure if geopolitical tensions around Iran ease, with traders potentially looking for selling interest to re‑emerge. In that scenario, the first key level to monitor may be 5238, a level which is equal to half the latest price strength. A closing break below 5238 could suggest weakening support and even point to further downside pressure.

While not an outright bearish signal on its own, closes below 5238 could suggest corrective pressure may well be building and deeper supports may then come into play, with the focus shifting first to the rising mid‑average at 5055, then even to 5018, which is the 38.2% Fibonacci retracement of February’s advance.
The material provided here has not been prepared accordance with legal requirements designed to promote the independence of investment research and as such is considered to be a marketing communication. Whilst it is not subject to any prohibition on dealing ahead of the dissemination of investment research, we will not seek to take any advantage before providing it to our clients.
Pepperstone doesn’t represent that the material provided here is accurate, current or complete, and therefore shouldn’t be relied upon as such. The information, whether from a third party or not, isn’t to be considered as a recommendation; or an offer to buy or sell; or the solicitation of an offer to buy or sell any security, financial product or instrument; or to participate in any particular trading strategy. It does not take into account readers’ financial situation or investment objectives. We advise any readers of this content to seek their own advice. Without the approval of Pepperstone, reproduction or redistribution of this information isn’t permitted.
However, geopolitics jumped to the forefront again on Friday after Bloomberg and other news agencies reported United Nations inspectors said Iran is conducting regular and unexplained activity at bombed uranium-enrichment sites, adding a major hurdle to on-going talks between US-Iran to agree a nuclear deal. This led Gold to spike 1.83% and close at a 1 month high of 5280. Gold is often seen as a safe haven during times of global upheaval or major geopolitical events, and traders were keen to add protection over the weekend.
It turns out that decision was a sound one, with the US and Israel carrying out combined strikes on targets across Iran on Saturday and Sunday, which was then followed by retaliatory strikes on US and Israeli bases in the Middle East region. The attacks on Tehran, the Iranian capital led to the death of the country’s Supreme Leader Ayatollah Khamenei and so far, officials have stated they will still not negotiate with the US. This all represents a major escalation and opens the possibility for a more extended conflict than initially anticipated. Perhaps unsurprisingly, Gold spiked another 2.5% this morning to fresh 1-month highs of 5419 in early trading (0730 GMT).
Whether Gold continues its recent up move to print new all-time highs above 5600, or falls back to lower levels may well depend on real time updates regarding how the fast moving situation in Iran develops over the next 48 hours, with traders sensitive to updates on the potential length of the conflict, support from US Congress for further escalation, and if the Iranian regime can maintain its rule of the country or eventually capitulates and opens the possibility of fresh negotiations.
Technical Update: Long Term Uptrend Resumption?
Gold strengthened into the weekend, with Friday’s close at the week’s upside extreme (5280), perhaps a sign of developing positive sentiment. Weekend events in Iran raised the likelihood of heightened volatility, and while the broader market impact remains to be seen this week, keeping key support and resistance levels in focus could be important for mapping out the next potential directional themes for Gold in the days ahead.
Potential Resistance Focus:
If the heightened geopolitical tensions escalate, traders might anticipate potential safe‑haven demand favouring further Gold strength. In that scenario, the first notable resistance may sit at 5451, a level which is equal to the January 30th high trade. A closing break above 5451 could reinforce upside momentum and open the door for attempts at additional price gains.
Gold’s ability to post successful closing breaks above 5451 could signal renewed momentum within the broader, still‑intact long‑term uptrend. Clearing that first resistance may open scope for tests of 5598, which is the January 29th all-time high. A break above 5598 could suggest the possibility of further price strength toward 6046, which is the 38.2% Fibonacci extension level.
Potential Support Focus:
Gold’s recent strength could face corrective pressure if geopolitical tensions around Iran ease, with traders potentially looking for selling interest to re‑emerge. In that scenario, the first key level to monitor may be 5238, a level which is equal to half the latest price strength. A closing break below 5238 could suggest weakening support and even point to further downside pressure.
While not an outright bearish signal on its own, closes below 5238 could suggest corrective pressure may well be building and deeper supports may then come into play, with the focus shifting first to the rising mid‑average at 5055, then even to 5018, which is the 38.2% Fibonacci retracement of February’s advance.
The material provided here has not been prepared accordance with legal requirements designed to promote the independence of investment research and as such is considered to be a marketing communication. Whilst it is not subject to any prohibition on dealing ahead of the dissemination of investment research, we will not seek to take any advantage before providing it to our clients.
Pepperstone doesn’t represent that the material provided here is accurate, current or complete, and therefore shouldn’t be relied upon as such. The information, whether from a third party or not, isn’t to be considered as a recommendation; or an offer to buy or sell; or the solicitation of an offer to buy or sell any security, financial product or instrument; or to participate in any particular trading strategy. It does not take into account readers’ financial situation or investment objectives. We advise any readers of this content to seek their own advice. Without the approval of Pepperstone, reproduction or redistribution of this information isn’t permitted.

Global risk Warning CFDs are complex instruments and come with a high risk of losing money rapidly due to leverage. Between 74-89% of retail investor accounts lose money when trading in CFDs. You should consider whether you understand how CFD
Wyłączenie odpowiedzialności
Informacje i publikacje nie stanowią i nie powinny być traktowane jako porady finansowe, inwestycyjne, tradingowe ani jakiekolwiek inne rekomendacje dostarczane lub zatwierdzone przez TradingView. Więcej informacji znajduje się w Warunkach użytkowania.
Global risk Warning CFDs are complex instruments and come with a high risk of losing money rapidly due to leverage. Between 74-89% of retail investor accounts lose money when trading in CFDs. You should consider whether you understand how CFD
Wyłączenie odpowiedzialności
Informacje i publikacje nie stanowią i nie powinny być traktowane jako porady finansowe, inwestycyjne, tradingowe ani jakiekolwiek inne rekomendacje dostarczane lub zatwierdzone przez TradingView. Więcej informacji znajduje się w Warunkach użytkowania.