
Current price: ~4,342
Bias: 🔴 Bearish below 4,443
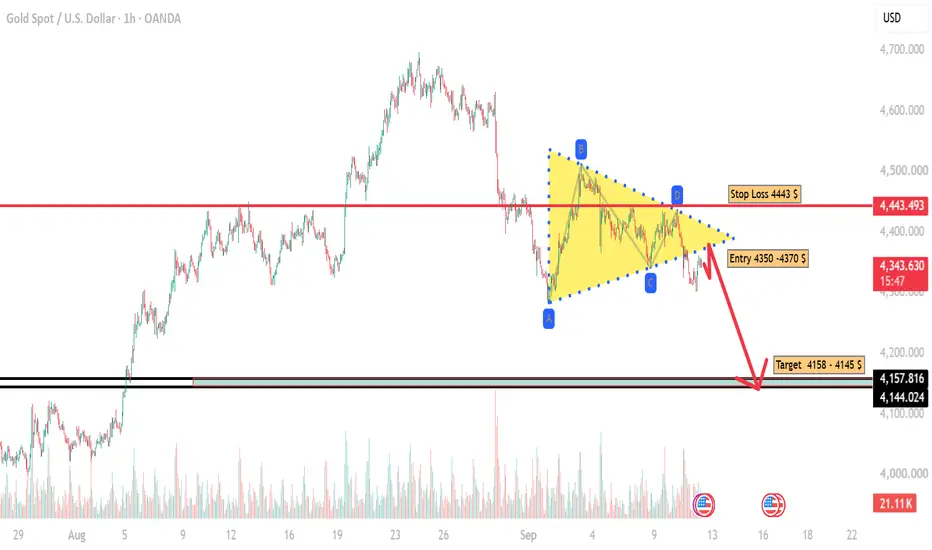
The 1H chart shows a contracting symmetrical triangle following the sharp decline from the 4,500 area. Price has completed the A–B–C–D structure and is now breaking below the lower boundary, increasing the probability of a bearish continuation.
📉 Bearish Setup
Entry Zone: 4,350 – 4,370
This area can act as a retest/supply zone after the breakdown.
Stop Loss: 4,443
A sustained move above 4,443 would invalidate the bearish setup and indicate a potential recovery back toward the upper part of the pattern.
Targets:
🎯 TP1: 4,158
🎯 TP2: 4,145
The 4,145–4,158 zone is particularly important because it represents the major horizontal support shown on the chart.
🔑 Key Levels
Level Role
4,443 Major resistance / invalidation
4,400–4,420 Near-term resistance
4,350–4,370 Short entry / retest zone
4,300 First psychological support
4,158–4,145 Major target/support zone
📊 Risk/Reward
Using the midpoint entry around 4,360:
Risk: 4,443 − 4,360 = 83 points
Reward to 4,158: 202 points
➡️ Approx. R:R = 1 : 2.43
To TP2 at 4,145, the R:R improves to roughly 1 : 2.59.
🧠 TradingView Interpretation
The important confirmation is not simply the price touching 4,350. The stronger bearish signal is:
Triangle breakdown → retest of 4,350–4,370 → rejection → continuation lower.
If Gold manages to reclaim 4,400 and especially closes a 1H candle above 4,443, the bearish thesis becomes invalid.
Trading plan:
SELL 4,350–4,370
SL 4,443
TP1 4,158
TP2 4,145
Overall: 🔴 Bearish continuation setup, with 4,443 as the key line in the sand.
Bias: 🔴 Bearish below 4,443
The 1H chart shows a contracting symmetrical triangle following the sharp decline from the 4,500 area. Price has completed the A–B–C–D structure and is now breaking below the lower boundary, increasing the probability of a bearish continuation.
📉 Bearish Setup
Entry Zone: 4,350 – 4,370
This area can act as a retest/supply zone after the breakdown.
Stop Loss: 4,443
A sustained move above 4,443 would invalidate the bearish setup and indicate a potential recovery back toward the upper part of the pattern.
Targets:
🎯 TP1: 4,158
🎯 TP2: 4,145
The 4,145–4,158 zone is particularly important because it represents the major horizontal support shown on the chart.
🔑 Key Levels
Level Role
4,443 Major resistance / invalidation
4,400–4,420 Near-term resistance
4,350–4,370 Short entry / retest zone
4,300 First psychological support
4,158–4,145 Major target/support zone
📊 Risk/Reward
Using the midpoint entry around 4,360:
Risk: 4,443 − 4,360 = 83 points
Reward to 4,158: 202 points
➡️ Approx. R:R = 1 : 2.43
To TP2 at 4,145, the R:R improves to roughly 1 : 2.59.
🧠 TradingView Interpretation
The important confirmation is not simply the price touching 4,350. The stronger bearish signal is:
Triangle breakdown → retest of 4,350–4,370 → rejection → continuation lower.
If Gold manages to reclaim 4,400 and especially closes a 1H candle above 4,443, the bearish thesis becomes invalid.
Trading plan:
SELL 4,350–4,370
SL 4,443
TP1 4,158
TP2 4,145
Overall: 🔴 Bearish continuation setup, with 4,443 as the key line in the sand.
Zlecenie aktywne

Wyłączenie odpowiedzialności
Informacje i publikacje nie stanowią i nie powinny być traktowane jako porady finansowe, inwestycyjne, tradingowe ani jakiekolwiek inne rekomendacje dostarczane lub zatwierdzone przez TradingView. Więcej informacji znajduje się w Warunkach użytkowania.
Wyłączenie odpowiedzialności
Informacje i publikacje nie stanowią i nie powinny być traktowane jako porady finansowe, inwestycyjne, tradingowe ani jakiekolwiek inne rekomendacje dostarczane lub zatwierdzone przez TradingView. Więcej informacji znajduje się w Warunkach użytkowania.