
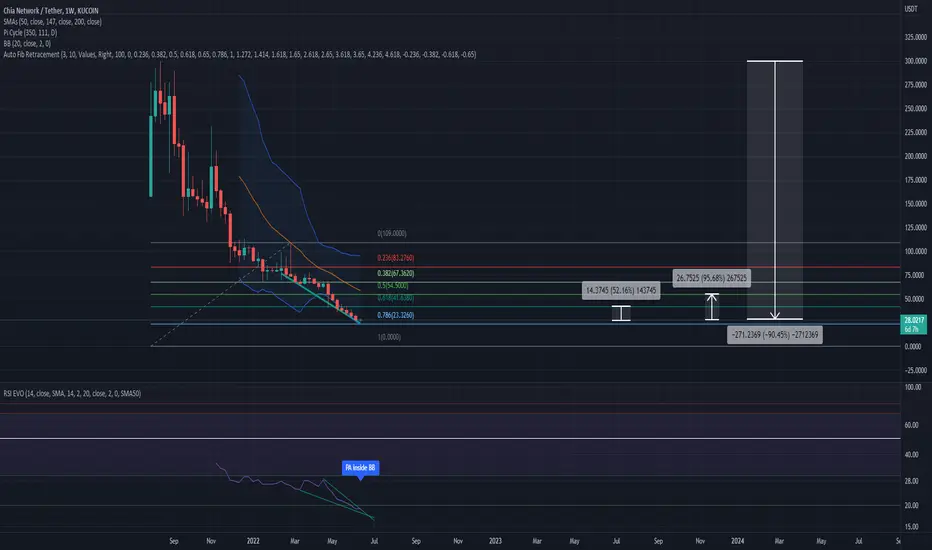
On the weekly chart above:
1) RSI has been heavily oversold for quite some time.
2) Bullish divergence as drawn, RSI forming descending wedge.
3) Price has declined over 90% from ATH.
Also the 3D BTC pair below breaks out of resistance quite decisively and prints a bullish engulfing candle (Also BE candle printed on 1W BTC pair. Wow!)

Initial targets 41-54 USDT (1.5-1.95x) as marked by fib retracement
Timeframe: Weeks
Leverage: 3x at most for me (although with these signals printing the probability of more downside is very slim)
Hasta luego
1) RSI has been heavily oversold for quite some time.
2) Bullish divergence as drawn, RSI forming descending wedge.
3) Price has declined over 90% from ATH.
Also the 3D BTC pair below breaks out of resistance quite decisively and prints a bullish engulfing candle (Also BE candle printed on 1W BTC pair. Wow!)
Initial targets 41-54 USDT (1.5-1.95x) as marked by fib retracement
Timeframe: Weeks
Leverage: 3x at most for me (although with these signals printing the probability of more downside is very slim)
Hasta luego
Uwaga
RSI breakout, Bullish engulfing on 5D USDT pairUwaga
As of right now, 38.5% up since publishingZlecenie aktywne
62% up and counting... Maybe consider taking profit soon.Transakcja zamknięta: osiągnięto wyznaczony cel
RSI, Bollinger Bands and resistance found on the MA all point to "take profit". WIll update this idea later for re-entry if I find it fitting. But haven't you made enough profit yet??

Wyłączenie odpowiedzialności
Informacje i publikacje nie stanowią i nie powinny być traktowane jako porady finansowe, inwestycyjne, tradingowe ani jakiekolwiek inne rekomendacje dostarczane lub zatwierdzone przez TradingView. Więcej informacji znajduje się w Warunkach użytkowania.
Wyłączenie odpowiedzialności
Informacje i publikacje nie stanowią i nie powinny być traktowane jako porady finansowe, inwestycyjne, tradingowe ani jakiekolwiek inne rekomendacje dostarczane lub zatwierdzone przez TradingView. Więcej informacji znajduje się w Warunkach użytkowania.