$XEM/#USDT [#NEM]: Resistance_Breakout_Confirmation
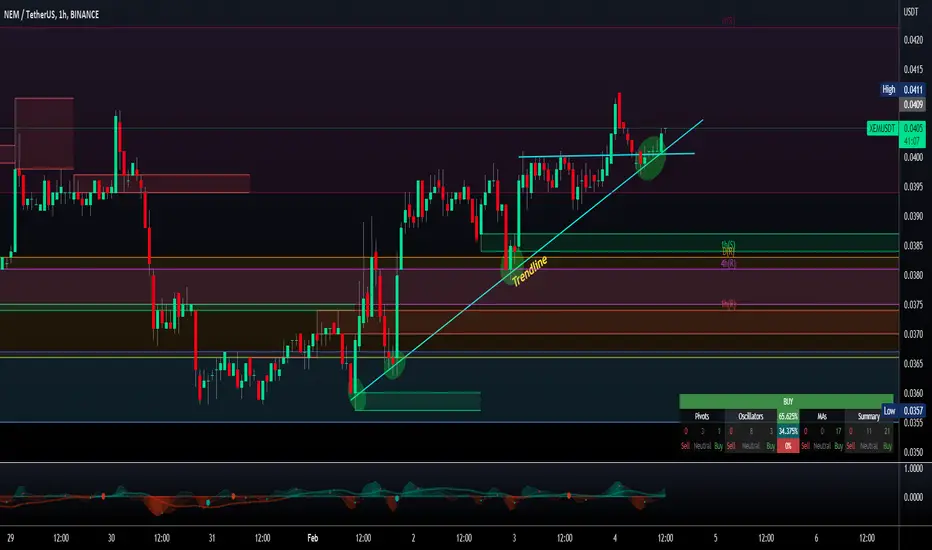
We've detected a Resistance Breakout and Confirmation on the  XEM /
XEM /  USDT chart. The price has broken above a key resistance level and has been confirmed by a strong candle, indicating a potential bullish trend. The next resistance key levels are at 0.0418 | 0.0442 | 0.0497 and the major support zones are respectively at 0.0363 | 0.0332 | 0.0277. We may consider entering a trade at the current price zone at 0.0405 and targetting higher levels.
- Technical Metrics:
-- Current price: 0.0405
-- 24H Volume: 569,818.2754 ₮
-- 24H Price change: 1.504%
- Pivot Points - Levels:
-- Resistance: 0.0418 | 0.0442 | 0.0497
-- Support: 0.0363 | 0.0332 | 0.0277
- Indicators recommandation:
-- Oscillators: NEUTRAL
-- Moving Averages: STRONG_BUY
--> Technical Indicators Summary: BUY
- In-depth XEMUSDT technical analysis on > Tradingview TA page

XEM / USDT chart. The price has broken above a key resistance level and has been confirmed by a strong candle, indicating a potential bullish trend. The next resistance key levels are at 0.0418 | 0.0442 | 0.0497 and the major support zones are respectively at 0.0363 | 0.0332 | 0.0277. We may consider entering a trade at the current price zone at 0.0405 and targetting higher levels.- Technical Metrics:
-- Current price: 0.0405
-- 24H Volume: 569,818.2754 ₮
-- 24H Price change: 1.504%
- Pivot Points - Levels:
-- Resistance: 0.0418 | 0.0442 | 0.0497
-- Support: 0.0363 | 0.0332 | 0.0277
- Indicators recommandation:
-- Oscillators: NEUTRAL
-- Moving Averages: STRONG_BUY
--> Technical Indicators Summary: BUY
- In-depth XEMUSDT technical analysis on > Tradingview TA page

Wyłączenie odpowiedzialności
Informacje i publikacje nie stanowią i nie powinny być traktowane jako porady finansowe, inwestycyjne, tradingowe ani jakiekolwiek inne rekomendacje dostarczane lub zatwierdzone przez TradingView. Więcej informacji znajduje się w Warunkach użytkowania.
Wyłączenie odpowiedzialności
Informacje i publikacje nie stanowią i nie powinny być traktowane jako porady finansowe, inwestycyjne, tradingowe ani jakiekolwiek inne rekomendacje dostarczane lub zatwierdzone przez TradingView. Więcej informacji znajduje się w Warunkach użytkowania.