
Complex Inverse Head & Shoulders on the XLF. Could rally higher.
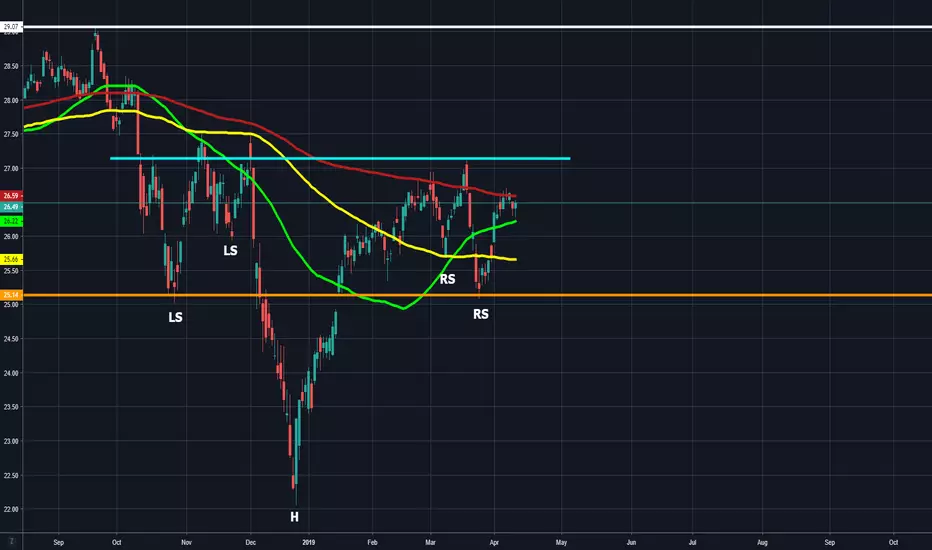
The XLF is currently forming what appears to be a complex inverse head and shoulders pattern. As it sits right now, price is holding between the 50 and 200 day moving averages (50 day acting as support, 200 day acting as resistance) and we could be setting up for a golden cross (50 MA crossing the 200 MA) into an eventual retest of the neckline of this complex inverse head and shoulders pattern which is around $27.10. The neckline of the inverse head and shoulders pattern can be drawn a few ways. I have the neckline around $27.10, but I can see arguments for $27.50. Regardless, I either want to see a break-out above the neckline with volume, or a break-out into a retest of the neckline as new support before consolidating and eventually moving higher.
Moving average guide (All daily for this post):
50 day moving average in Green.
100 day moving average in Yellow.
200 day moving average in Red.
-This is not financial advice. Always do your own research and own due-diligence before investing and trading, as for investing and trading comes with high amounts of risk. I am not liable for any incurred losses or financial distress.
Moving average guide (All daily for this post):
50 day moving average in Green.
100 day moving average in Yellow.
200 day moving average in Red.
-This is not financial advice. Always do your own research and own due-diligence before investing and trading, as for investing and trading comes with high amounts of risk. I am not liable for any incurred losses or financial distress.
Uwaga
XLF is currently up about 2.80% from when I made my post, looking good so far. I really want to see a strong push above $27.50: Uwaga
Off to the races: 
Wyłączenie odpowiedzialności
Informacje i publikacje nie stanowią i nie powinny być traktowane jako porady finansowe, inwestycyjne, tradingowe ani jakiekolwiek inne rekomendacje dostarczane lub zatwierdzone przez TradingView. Więcej informacji znajduje się w Warunkach użytkowania.
Wyłączenie odpowiedzialności
Informacje i publikacje nie stanowią i nie powinny być traktowane jako porady finansowe, inwestycyjne, tradingowe ani jakiekolwiek inne rekomendacje dostarczane lub zatwierdzone przez TradingView. Więcej informacji znajduje się w Warunkach użytkowania.