Long
XLM is Bullish
SWING TRADING ANALYSIS
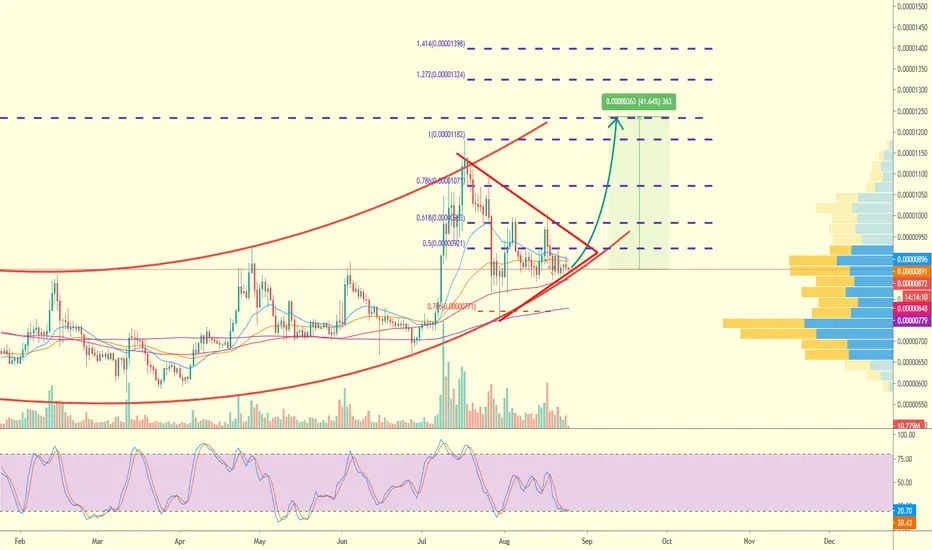
XLM in the bullish channel(red lines) right know, it can higher because the volume of accumulation is high in currently price, you can see it from the spike of volume profile
The decreasing of volume is a sign that it will pump in a days
The oscilator showed the price is currenctly low, that means it is oversold right know
Trading plan :
Entry : 850 - 890
Target 1 : 1074
Target 2 : 1186
Target 3 : 1238
Target 4 : 1328
Stop loss : 800
Enjoy the profit later 🤑🤑🤑
XLM in the bullish channel(red lines) right know, it can higher because the volume of accumulation is high in currently price, you can see it from the spike of volume profile
The decreasing of volume is a sign that it will pump in a days
The oscilator showed the price is currenctly low, that means it is oversold right know
Trading plan :
Entry : 850 - 890
Target 1 : 1074
Target 2 : 1186
Target 3 : 1238
Target 4 : 1328
Stop loss : 800
Enjoy the profit later 🤑🤑🤑

Wyłączenie odpowiedzialności
Informacje i publikacje nie stanowią i nie powinny być traktowane jako porady finansowe, inwestycyjne, tradingowe ani jakiekolwiek inne rekomendacje dostarczane lub zatwierdzone przez TradingView. Więcej informacji znajduje się w Warunkach użytkowania.
Wyłączenie odpowiedzialności
Informacje i publikacje nie stanowią i nie powinny być traktowane jako porady finansowe, inwestycyjne, tradingowe ani jakiekolwiek inne rekomendacje dostarczane lub zatwierdzone przez TradingView. Więcej informacji znajduje się w Warunkach użytkowania.