
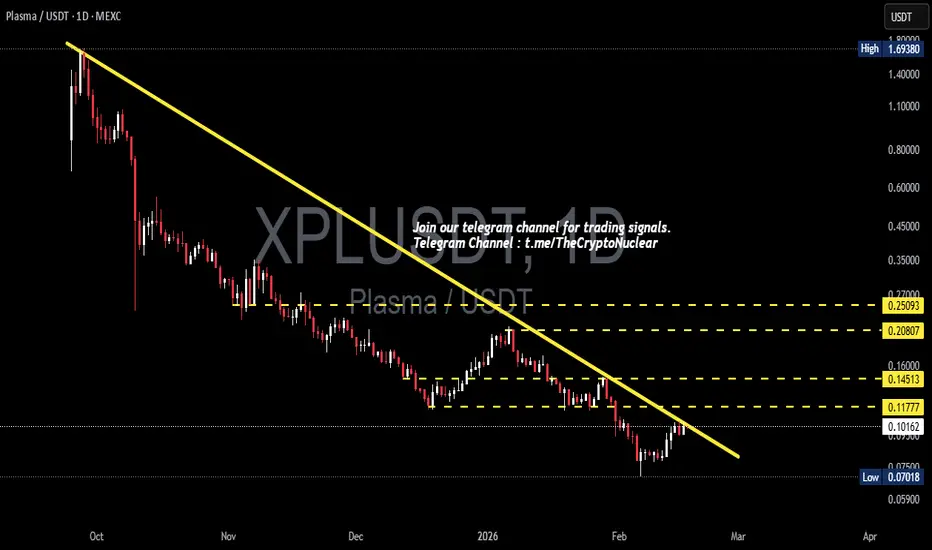
On the 1D timeframe, the price movement of XPL/USDT (Plasma) remains within a strong downtrend structure since the distribution phase at the previous top area.
Clearly visible sequences of:
Lower High
Lower Low
Dominant selling pressure
Weakening volume during retracements
The descending trendline acts as a major dynamic resistance that continues to suppress price movement.
Price is currently trading in the lower structure area — approaching a minor demand zone after printing a new low.
---
Pattern / Structure
The structures formed on the chart:
1. Descending Trendline
The downward trendline connects swing highs to subsequent swing highs → valid as dynamic resistance.
Validation characteristics:
Touched multiple times
Consistently triggers rejection
Stable downward angle
2. Bearish Continuation Structure
Price movement forms a pattern of:
Bearish impulse
Small sideways movement
Continued decline
This indicates a bearish continuation phase, not a reversal.
3. Base Formation (Early Accumulation) – Minor
In the latest low area, signs begin to appear:
Lower wick rejections
Long downside wicks
Narrow consolidation
However, it is still too early to classify this as a valid reversal.
---
Key Levels
Resistance
0.11777 → Minor / mid-range resistance
0.14513 → Strong supply
0.20807 → Breakout confirmation level
0.25093 → Major resistance / distribution zone
Support
0.10067 → Running support
0.07500 area → Demand zone
0.07018 → Swing low / last defense
---
Bullish Scenario
Bullish momentum is only valid if the following structure breaks:
Main triggers:
Break & close above the trendline
Break above 0.11777
Further confirmation:
1. Successful trendline retest
2. Formation of a higher low
3. Increasing volume
Upside targets:
0.14513
0.20807
0.25093
If 0.25093 breaks → the market structure could shift into a mid-term trend reversal.
---
Bearish Scenario
As long as price remains below the trendline → bearish bias remains dominant.
Potential scenarios:
1. Rejection at the trendline
2. Failure to reclaim 0.11777
3. Breakdown below 0.10067
Downside targets:
0.07500
0.07018 (current low)
If 0.07018 breaks → high probability of entering downside price discovery (new ATL).
---
Conclusion
Main trend: Bearish
Structure: Lower High – Lower Low
Key resistance: Trendline + 0.11777
Current area: Lower demand / minor base
The market is currently at a critical phase:
Break the trendline → reversal potential
Rejection → continuation lower
In other words:
This is a decision zone for the next major move.
#XPLUSDT #XPL #CryptoAnalysis #TechnicalAnalysis #AltcoinSetup #Downtrend #TrendlineBreak #CryptoTrading #SupportResistance
Clearly visible sequences of:
Lower High
Lower Low
Dominant selling pressure
Weakening volume during retracements
The descending trendline acts as a major dynamic resistance that continues to suppress price movement.
Price is currently trading in the lower structure area — approaching a minor demand zone after printing a new low.
---
Pattern / Structure
The structures formed on the chart:
1. Descending Trendline
The downward trendline connects swing highs to subsequent swing highs → valid as dynamic resistance.
Validation characteristics:
Touched multiple times
Consistently triggers rejection
Stable downward angle
2. Bearish Continuation Structure
Price movement forms a pattern of:
Bearish impulse
Small sideways movement
Continued decline
This indicates a bearish continuation phase, not a reversal.
3. Base Formation (Early Accumulation) – Minor
In the latest low area, signs begin to appear:
Lower wick rejections
Long downside wicks
Narrow consolidation
However, it is still too early to classify this as a valid reversal.
---
Key Levels
Resistance
0.11777 → Minor / mid-range resistance
0.14513 → Strong supply
0.20807 → Breakout confirmation level
0.25093 → Major resistance / distribution zone
Support
0.10067 → Running support
0.07500 area → Demand zone
0.07018 → Swing low / last defense
---
Bullish Scenario
Bullish momentum is only valid if the following structure breaks:
Main triggers:
Break & close above the trendline
Break above 0.11777
Further confirmation:
1. Successful trendline retest
2. Formation of a higher low
3. Increasing volume
Upside targets:
0.14513
0.20807
0.25093
If 0.25093 breaks → the market structure could shift into a mid-term trend reversal.
---
Bearish Scenario
As long as price remains below the trendline → bearish bias remains dominant.
Potential scenarios:
1. Rejection at the trendline
2. Failure to reclaim 0.11777
3. Breakdown below 0.10067
Downside targets:
0.07500
0.07018 (current low)
If 0.07018 breaks → high probability of entering downside price discovery (new ATL).
---
Conclusion
Main trend: Bearish
Structure: Lower High – Lower Low
Key resistance: Trendline + 0.11777
Current area: Lower demand / minor base
The market is currently at a critical phase:
Break the trendline → reversal potential
Rejection → continuation lower
In other words:
This is a decision zone for the next major move.
#XPLUSDT #XPL #CryptoAnalysis #TechnicalAnalysis #AltcoinSetup #Downtrend #TrendlineBreak #CryptoTrading #SupportResistance

✅ Get Free Signals! Join Our Telegram Channel Here: t.me/TheCryptoNuclear
✅ Twitter: twitter.com/crypto_nuclear
✅ Join Bybit : partner.bybit.com/b/nuclearvip
✅ Benefits : Lifetime Trading Fee Discount -50%
✅ Twitter: twitter.com/crypto_nuclear
✅ Join Bybit : partner.bybit.com/b/nuclearvip
✅ Benefits : Lifetime Trading Fee Discount -50%
Wyłączenie odpowiedzialności
Informacje i publikacje nie stanowią i nie powinny być traktowane jako porady finansowe, inwestycyjne, tradingowe ani jakiekolwiek inne rekomendacje dostarczane lub zatwierdzone przez TradingView. Więcej informacji znajduje się w Warunkach użytkowania.
✅ Get Free Signals! Join Our Telegram Channel Here: t.me/TheCryptoNuclear
✅ Twitter: twitter.com/crypto_nuclear
✅ Join Bybit : partner.bybit.com/b/nuclearvip
✅ Benefits : Lifetime Trading Fee Discount -50%
✅ Twitter: twitter.com/crypto_nuclear
✅ Join Bybit : partner.bybit.com/b/nuclearvip
✅ Benefits : Lifetime Trading Fee Discount -50%
Wyłączenie odpowiedzialności
Informacje i publikacje nie stanowią i nie powinny być traktowane jako porady finansowe, inwestycyjne, tradingowe ani jakiekolwiek inne rekomendacje dostarczane lub zatwierdzone przez TradingView. Więcej informacji znajduje się w Warunkach użytkowania.