
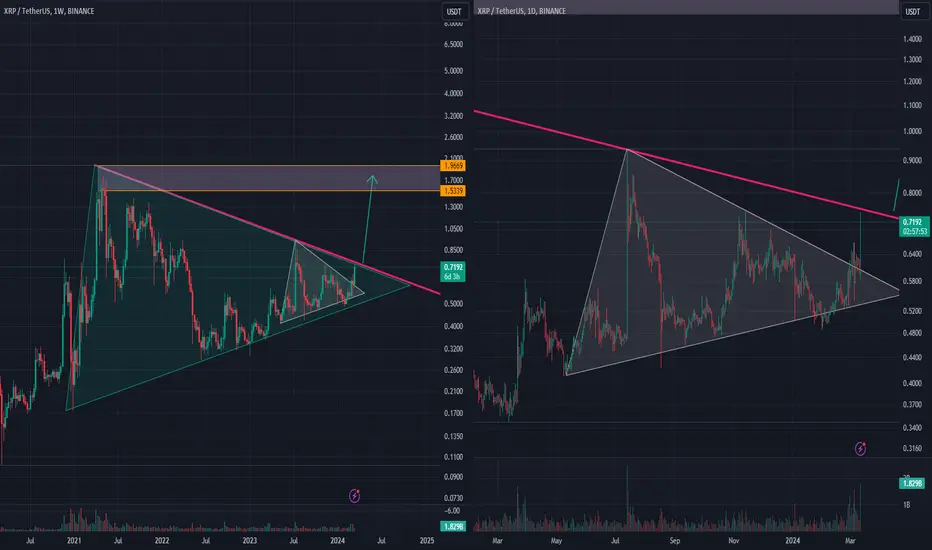
Currently, the price of the XRP has reached the descending trend line from higher timeframes, which is identified by the highs of April 2021 and July 2023. Additionally, this trend line serves as the upper boundary of a symmetrical triangle.
A similar symmetrical triangle pattern has also formed on timeframes from 1D and below, and the price of the asset has already managed to establish itself above it.
In the current conditions of a bullish trend, it is more likely for the asset to to break above this weekly/monthly trend line and exit this huge triangle to the upside. Potential targets could be the values at the top of the symmetrical triangle, ranging from $1.53 to $1.96.
A similar symmetrical triangle pattern has also formed on timeframes from 1D and below, and the price of the asset has already managed to establish itself above it.
In the current conditions of a bullish trend, it is more likely for the asset to to break above this weekly/monthly trend line and exit this huge triangle to the upside. Potential targets could be the values at the top of the symmetrical triangle, ranging from $1.53 to $1.96.

Wyłączenie odpowiedzialności
Informacje i publikacje nie stanowią i nie powinny być traktowane jako porady finansowe, inwestycyjne, tradingowe ani jakiekolwiek inne rekomendacje dostarczane lub zatwierdzone przez TradingView. Więcej informacji znajduje się w Warunkach użytkowania.
Wyłączenie odpowiedzialności
Informacje i publikacje nie stanowią i nie powinny być traktowane jako porady finansowe, inwestycyjne, tradingowe ani jakiekolwiek inne rekomendacje dostarczane lub zatwierdzone przez TradingView. Więcej informacji znajduje się w Warunkach użytkowania.