
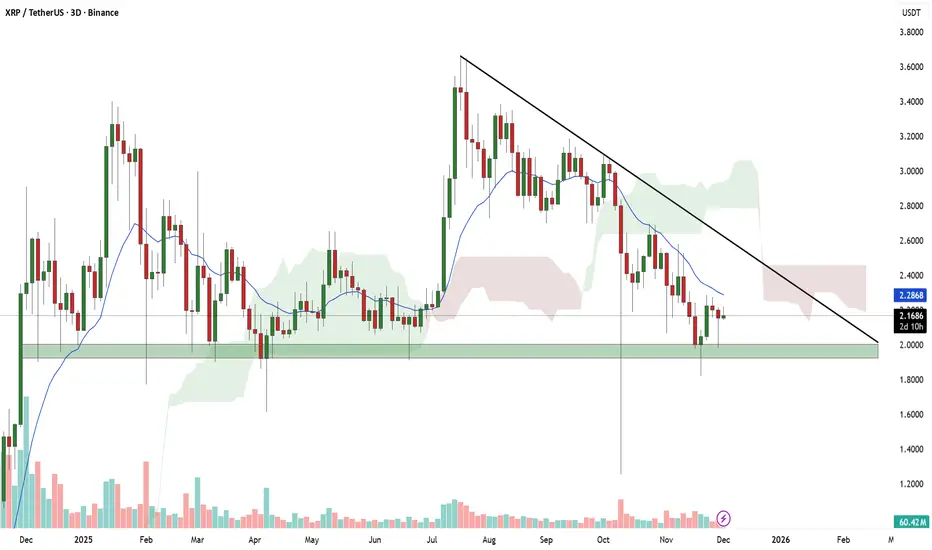
On the 3-day chart, **XRP/USDT** is trading inside a broad descending triangle structure, with a clear pattern of lower highs meeting a flat demand base around the **$2.00–$2.10** zone. Price has repeatedly tested this green support area, showing strong buyer defense but also declining momentum as each rebound becomes weaker. The **trendline from the previous top near $3.20** continues to cap all recovery attempts, acting as dynamic resistance.
Currently, the candle is hovering near **$2.17**, just above the main demand region, while the EMA-9 is trending downward, signaling short-term bearish pressure. However, as long as the structure holds above **$2.00**, bulls still have a chance to stage a rebound toward **$2.28–$2.40**, which is the next resistance area aligned with the descending trendline and cloud rejection zone. A clean daily close below **$2.00** would invalidate the support and likely open room toward **$1.80–$1.70**, but a confirmed breakout above the trendline could trigger a reversal pattern toward **$2.80–$3.00**.
In short, XRP remains at a critical decision point—holding the demand zone shows accumulation, while rejection from the descending resistance continues to suppress upside momentum.
Currently, the candle is hovering near **$2.17**, just above the main demand region, while the EMA-9 is trending downward, signaling short-term bearish pressure. However, as long as the structure holds above **$2.00**, bulls still have a chance to stage a rebound toward **$2.28–$2.40**, which is the next resistance area aligned with the descending trendline and cloud rejection zone. A clean daily close below **$2.00** would invalidate the support and likely open room toward **$1.80–$1.70**, but a confirmed breakout above the trendline could trigger a reversal pattern toward **$2.80–$3.00**.
In short, XRP remains at a critical decision point—holding the demand zone shows accumulation, while rejection from the descending resistance continues to suppress upside momentum.

SpyOnGems (Mayank) | Technical Analysis & Education | Telegram: t.me/spyongems
Wyłączenie odpowiedzialności
Informacje i publikacje nie stanowią i nie powinny być traktowane jako porady finansowe, inwestycyjne, tradingowe ani jakiekolwiek inne rekomendacje dostarczane lub zatwierdzone przez TradingView. Więcej informacji znajduje się w Warunkach użytkowania.
SpyOnGems (Mayank) | Technical Analysis & Education | Telegram: t.me/spyongems
Wyłączenie odpowiedzialności
Informacje i publikacje nie stanowią i nie powinny być traktowane jako porady finansowe, inwestycyjne, tradingowe ani jakiekolwiek inne rekomendacje dostarczane lub zatwierdzone przez TradingView. Więcej informacji znajduje się w Warunkach użytkowania.