
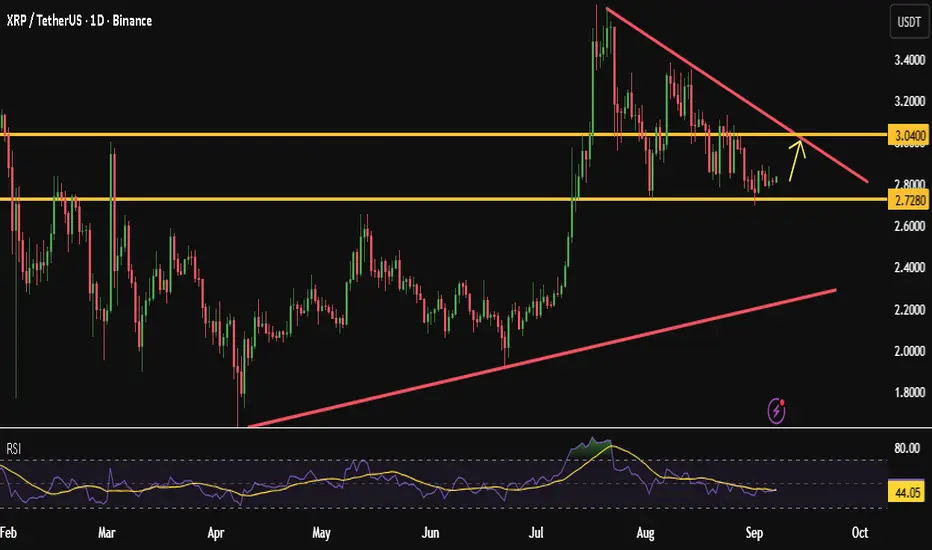
XRP , After failing to break the previous low, which acted as a strong support at $2.7280, XRP has formed a Double Bottom pattern. This is a powerful bullish signal expected to push the price higher.
The price is currently rising to test the daily descending trendline shown in the chart, with a potential target of the $3.04000 zone. The bullish move is also confirmed by a Divergence pattern on the daily chart.
Additionally, the daily RSI shows an overbought signal, which can be a sign of strong buying pressure. This movement is also supported by the overall daily uptrend illustrated in the chart.
🔔 Summary:
Key Factors Supporting an Upside Move
Double Bottom Pattern
Daily Divergence
Uptrend
Daily RSI Overbought Signal
✅ Write a comment with your favorite altcoin hit the like button, and I'll provide my analysis in the reply. Trading is simpler with the right coaching.
My analyses are personal opinions, not trade setups.
Thank you for your support, and I wish you successful trades 🌹
Zlecenie aktywne
Following up on our analysis: The price is now heading to test the descending trendline at 3.0400, exactly as we predicted.
Transakcja zamknięta: osiągnięto wyznaczony cel

Wyłączenie odpowiedzialności
Informacje i publikacje nie stanowią i nie powinny być traktowane jako porady finansowe, inwestycyjne, tradingowe ani jakiekolwiek inne rekomendacje dostarczane lub zatwierdzone przez TradingView. Więcej informacji znajduje się w Warunkach użytkowania.
Wyłączenie odpowiedzialności
Informacje i publikacje nie stanowią i nie powinny być traktowane jako porady finansowe, inwestycyjne, tradingowe ani jakiekolwiek inne rekomendacje dostarczane lub zatwierdzone przez TradingView. Więcej informacji znajduje się w Warunkach użytkowania.