
WTI Crude Oil (XTI/USD): 28 Apr 2026 - Elliott Wave
Summary:
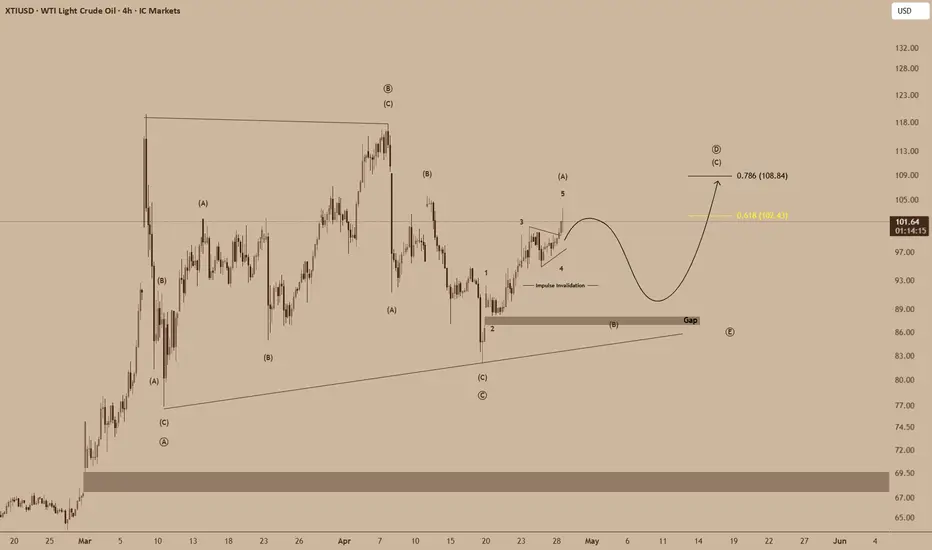
The chart suggests WTI crude may have completed a larger corrective decline near the $84 to $86 demand zone, where price reacted strongly and began forming a new impulsive recovery sequence.
A clear five wave advance appears to be developing from the recent low, with waves 1 through 4 likely completed and price now attempting wave 5 higher into nearby resistance. This short term move could finalize wave (A) of a broader corrective recovery.
After the current rise, the projected path indicates a temporary pullback toward the previous gap/support zone near $86 to $88 for wave (B), before a stronger continuation higher in wave (C).
The upside Fibonacci targets for the broader recovery are:
0.618 retracement near $102.43
0.786 retracement near $108.84
Conclusion:
Bias is cautiously bullish while price remains above the recent swing low and gap support. Near term strength may continue first, followed by a corrective dip, then another leg higher toward the $102 to $109 region.
Key Levels:
Support: $86.00 to $88.00
Invalidation: Below $84.00
Target 1: $102.43
Target 2: $108.84
Summary:
The chart suggests WTI crude may have completed a larger corrective decline near the $84 to $86 demand zone, where price reacted strongly and began forming a new impulsive recovery sequence.
A clear five wave advance appears to be developing from the recent low, with waves 1 through 4 likely completed and price now attempting wave 5 higher into nearby resistance. This short term move could finalize wave (A) of a broader corrective recovery.
After the current rise, the projected path indicates a temporary pullback toward the previous gap/support zone near $86 to $88 for wave (B), before a stronger continuation higher in wave (C).
The upside Fibonacci targets for the broader recovery are:
0.618 retracement near $102.43
0.786 retracement near $108.84
Conclusion:
Bias is cautiously bullish while price remains above the recent swing low and gap support. Near term strength may continue first, followed by a corrective dip, then another leg higher toward the $102 to $109 region.
Key Levels:
Support: $86.00 to $88.00
Invalidation: Below $84.00
Target 1: $102.43
Target 2: $108.84

Powiązane publikacje
Wyłączenie odpowiedzialności
Informacje i publikacje nie stanowią i nie powinny być traktowane jako porady finansowe, inwestycyjne, tradingowe ani jakiekolwiek inne rekomendacje dostarczane lub zatwierdzone przez TradingView. Więcej informacji znajduje się w Warunkach użytkowania.
Powiązane publikacje
Wyłączenie odpowiedzialności
Informacje i publikacje nie stanowią i nie powinny być traktowane jako porady finansowe, inwestycyjne, tradingowe ani jakiekolwiek inne rekomendacje dostarczane lub zatwierdzone przez TradingView. Więcej informacji znajduje się w Warunkach użytkowania.