Long
[DAY] Elliott Waves Forecast for YFIBTC
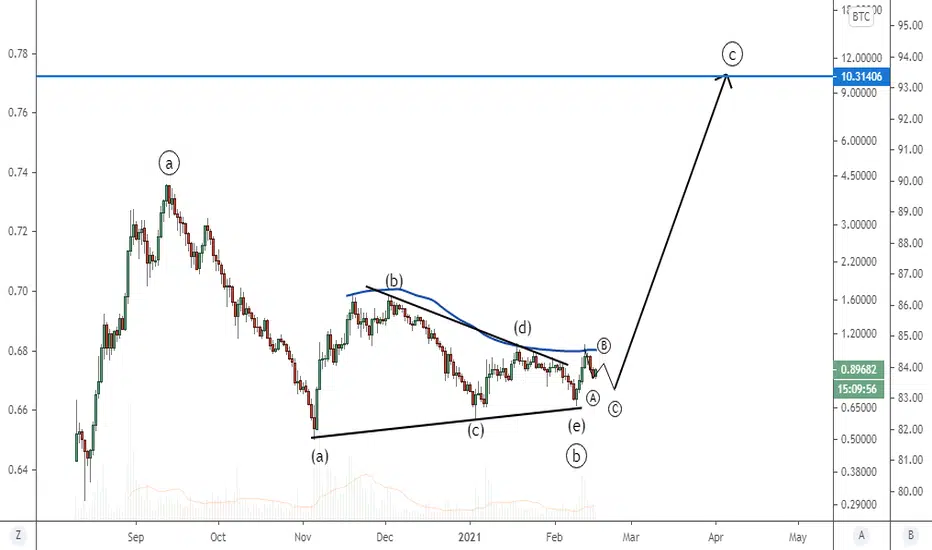
YFIBTC shows a very distinct ABCDE pattern that started on Sept 12th 2020 and ended on Feb 9th
The pair is now bullish with 5 waves swing completed on Feb 12th
Now the question remains whether the correction ended or whether we are in a B that will be followed by a C towards the 0.77 level
I prefer the second scenario considering the current choppiness of the market
At contrary if the previous high is overtaken, it would be a strong buy signal
The mid term/long term target is not well defined but in any scenario it would be of course higher than the major A
See further updates in comment section
The pair is now bullish with 5 waves swing completed on Feb 12th
Now the question remains whether the correction ended or whether we are in a B that will be followed by a C towards the 0.77 level
I prefer the second scenario considering the current choppiness of the market
At contrary if the previous high is overtaken, it would be a strong buy signal
The mid term/long term target is not well defined but in any scenario it would be of course higher than the major A
See further updates in comment section
Zlecenie aktywne
ABC looks complete

Powiązane publikacje
Wyłączenie odpowiedzialności
Informacje i publikacje nie stanowią i nie powinny być traktowane jako porady finansowe, inwestycyjne, tradingowe ani jakiekolwiek inne rekomendacje dostarczane lub zatwierdzone przez TradingView. Więcej informacji znajduje się w Warunkach użytkowania.
Powiązane publikacje
Wyłączenie odpowiedzialności
Informacje i publikacje nie stanowią i nie powinny być traktowane jako porady finansowe, inwestycyjne, tradingowe ani jakiekolwiek inne rekomendacje dostarczane lub zatwierdzone przez TradingView. Więcej informacji znajduje się w Warunkach użytkowania.