
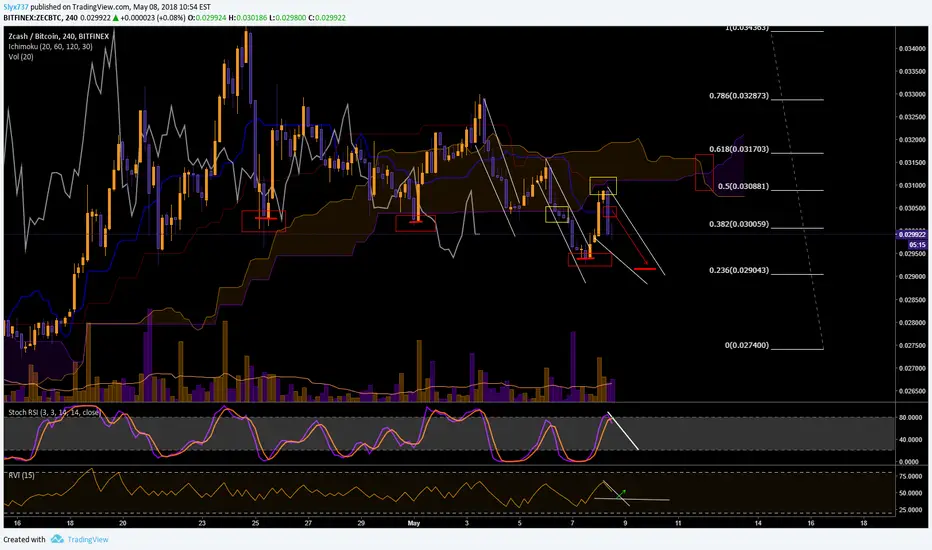
ZEC price has been legging down and each low as well as making lower highs as seen by the red boxes.
As for the yellow boxes the one on the left shows us where the price tested the Kumo support, breaking to the downside. After that low was found the price tried to retest at the 2nd box and was unable to penetrate the cloud.
RSI and RVI are both moving in a bearish direction which would confirm that price trajectory in the wedge and a possible bounce from the 0.236 fib level.
As for the yellow boxes the one on the left shows us where the price tested the Kumo support, breaking to the downside. After that low was found the price tried to retest at the 2nd box and was unable to penetrate the cloud.
RSI and RVI are both moving in a bearish direction which would confirm that price trajectory in the wedge and a possible bounce from the 0.236 fib level.
Uwaga
Price continued downward through it's channel and bounced exactly off of our predicted support level.
Wyłączenie odpowiedzialności
Informacje i publikacje nie stanowią i nie powinny być traktowane jako porady finansowe, inwestycyjne, tradingowe ani jakiekolwiek inne rekomendacje dostarczane lub zatwierdzone przez TradingView. Więcej informacji znajduje się w Warunkach użytkowania.
Wyłączenie odpowiedzialności
Informacje i publikacje nie stanowią i nie powinny być traktowane jako porady finansowe, inwestycyjne, tradingowe ani jakiekolwiek inne rekomendacje dostarczane lub zatwierdzone przez TradingView. Więcej informacji znajduje się w Warunkach użytkowania.