Horizen Hits Support (Full Chart Mapped)
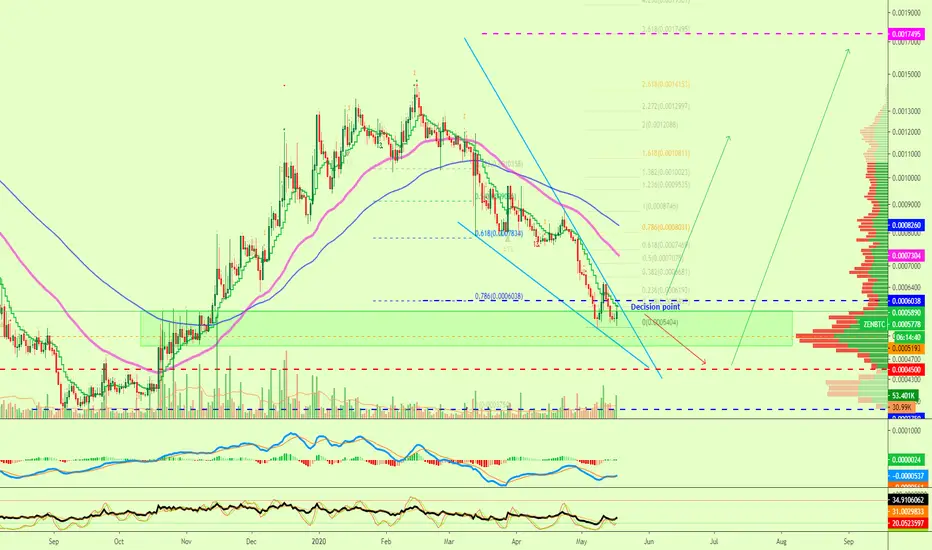
Here we have the chart for Horizen (ZENBTC) fully mapped.
On the chart above we have the most important Fib. levels marked.
Fib. retracement (support) and extension (resistance).
You can look at the "Decision Point" at 0.0006038 to know where prices will be headed next.
Since Horizen is now trading near strong support with some early signals showing up, chances are that prices can move up here, still, the 0.0006038 needs to be conquered first for confirmation.
This is not financial advice.
Thanks a lot for your support.
Namaste.
On the chart above we have the most important Fib. levels marked.
Fib. retracement (support) and extension (resistance).
You can look at the "Decision Point" at 0.0006038 to know where prices will be headed next.
- Below this level, ZENBTC goes bearish (we remain bullish even if prices drop).
- Above this level, ZENBTC goes bullish.
Since Horizen is now trading near strong support with some early signals showing up, chances are that prices can move up here, still, the 0.0006038 needs to be conquered first for confirmation.
This is not financial advice.
Thanks a lot for your support.
Namaste.

✅ Cryptocurrencies technical analysis & results
t.me/masteranandatrades/9279
✅ Stocks technical analysis
t.me/anandastocks
✅ Enjoyed the content?
Join PREMIUM channels to show your support!
t.me/lamatrades/4 (since 2017)
t.me/masteranandatrades/9279
✅ Stocks technical analysis
t.me/anandastocks
✅ Enjoyed the content?
Join PREMIUM channels to show your support!
t.me/lamatrades/4 (since 2017)
Powiązane publikacje
Wyłączenie odpowiedzialności
Informacje i publikacje nie stanowią i nie powinny być traktowane jako porady finansowe, inwestycyjne, tradingowe ani jakiekolwiek inne rekomendacje dostarczane lub zatwierdzone przez TradingView. Więcej informacji znajduje się w Warunkach użytkowania.
✅ Cryptocurrencies technical analysis & results
t.me/masteranandatrades/9279
✅ Stocks technical analysis
t.me/anandastocks
✅ Enjoyed the content?
Join PREMIUM channels to show your support!
t.me/lamatrades/4 (since 2017)
t.me/masteranandatrades/9279
✅ Stocks technical analysis
t.me/anandastocks
✅ Enjoyed the content?
Join PREMIUM channels to show your support!
t.me/lamatrades/4 (since 2017)
Powiązane publikacje
Wyłączenie odpowiedzialności
Informacje i publikacje nie stanowią i nie powinny być traktowane jako porady finansowe, inwestycyjne, tradingowe ani jakiekolwiek inne rekomendacje dostarczane lub zatwierdzone przez TradingView. Więcej informacji znajduje się w Warunkach użytkowania.