CBOT: 10-Year T-Notes Futures (  ZN1!)
ZN1!)
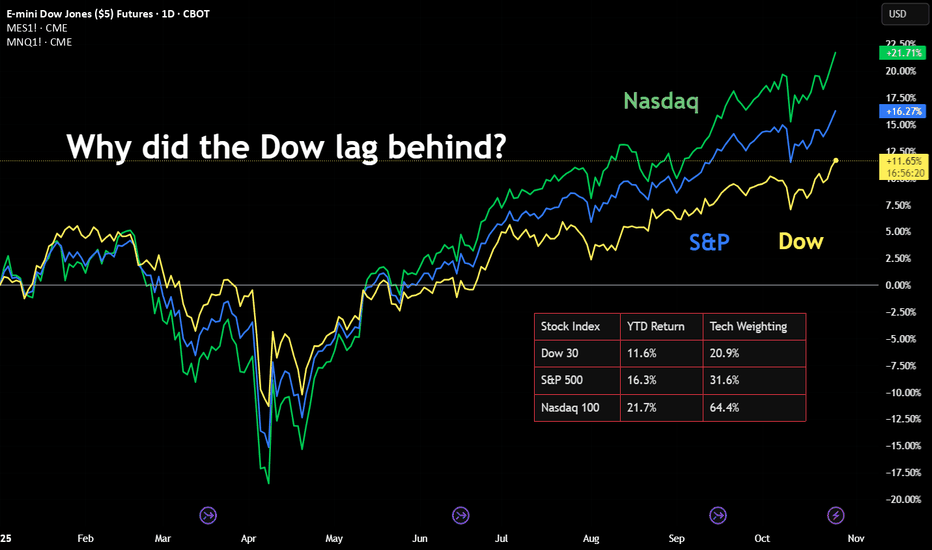
Since hitting an all-time high (ATH) of 48,431 on November 12th, the Dow Jones Industrial Average lost 1,841 points, or -3.8%, to 46,590 on Monday.
Meanwhile, the Nasdaq Composite has lost over 1,300 points, or -5.5%, from its ATH of 24,020. The S&P 500 is down 250 points, or -3.6%, from 6,920. Both the Nasdaq and the S&P reached their ATH on October 29th.
Cryptocurrencies have been harder hit than stocks. Today, Bitcoin prices dropped below $90,000, a whopping 29% drawdown since the King of Crypto hit ATH of $126,080. An entire year of gains has been erased.
Two key market forces are driving the US stock market downtrend.
Firstly, Wall Street grew worried about the AI bubble bursting. Earlier this month, “Big Short” investor Michael Burry grabbed headlines after his Scion Investment’s 13F filing showed bearish bets on Nvidia (NVDA) and Palantir (PLTR). Last week, Softbank offloaded all 32.1 million shares of NVDA it held. This is followed by Peter Thiel’s hedge fund, which sold off all 537,742 shares of NVDA on Monday.
On my October 27th commentary, I discussed that heavy exposure in High Tech stocks (64%) made Nasdaq very venerable. The Dow could weather the downturn better with a lower weight (21%). The recent market trend resonates with my theory.
Secondly, the Federal Reserve has turned hawkish on monetary policy. The Fed made the last rate cut on October 29th, without the aid of updated economic data due to US government shutdown. Fed officials have warned that further rate cuts are not a sure thing if new data does not support policy easing.
On October 27th, the odds for a December cut were 98.5%, according to data from the CME FedWatch tool. Today, it went down sharply to just 57%. Not cutting has the same effect as raising expected interest rates, which tends to drive down stock valuation.

cmegroup.com/markets/interest-rates/cme-fedwatch-tool.html
The Future is Less Uncertain than the Present
In my view, the market obsession with what the Fed Chair says day by day is overblown. Anybody remember a quote from Alan Greenspan? While modeling short-term decisions into long-term trends, we risk overlooking the impact from changing of guards at the Fed.
The current Fed Chair’s term will end in May 2026. Between now and then, there are four FOMC rate-setting meetings: December 9-10, 2025, January 27-28, March 17-18 and April 28-29 in 2026. What could possibly happen in four meetings:
• If the Fed is hawkish and refuses to cut rates, the policy Fed Funds rate could stay at the current 375-400 bp range.
• If the Fed turns dovish and cut 25bp every time, Fed Funds could be at 275-300 bp.
In recent meetings, the Fed no longer had consensus in its policy votes. Each decision is like a toss-up. If we only focus on the short term, trading results could be very volatile.
The next Fed Chair will be nominated by President Trump and confirmed by the Senate. We know for a fact that the President favors aggressive rate cuts to support the economy. Only someone who is 100% in agreement with the President could get nominated.
Latest news indicates that five candidates have made it to the final list to be considered for a Fed Chair nomination. They are Michelle Bowman, Christopher Waller, Kevin Warsh, Kevin Hassett and Rick Rieder.
If the Senate confirmation gets delayed, the President could pick a current Fed governor as Acting Chair. Whoever that may be, he or she will have to align with the President in terms of the direction of monetary policy. Gone with the independent central bank.
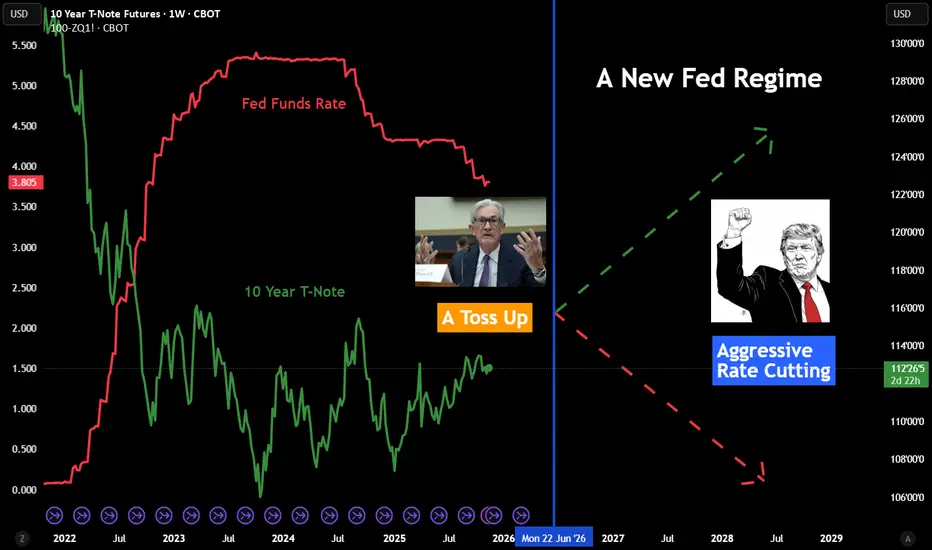
Even though we have no idea what happens next month, we could still form a good estimate of what the Fed will do in the next 2-1/2 years, starting in June 2026.
In my opinion, the expected policy rate will eventually go down to 1.0-1.5%, or even lower. This is not what the Fed currently says. Instead, I am forming an opinion based on a new Fed regime with a new Chair and multiple Fed governors supporting rate cuts.
With that in mind, we can now discuss trade strategies going beyond the next Fed meeting. We don’t have to wait a long time for everything to move in places. Once a new Fed Chair candidate is announced, the market will start pricing a different interest rate trajectory. Latest news suggests that the President may be meeting with three candidates after the Thanksgiving holiday.
Trading with 10 Year T-Notes Futures
As I mentioned earlier, US stocks have the risk of AI bubble bursting. We could wait a while to see how things play out. My trade idea today is a pure play on interest rates.
We know that Treasury prices are negatively correlated with interest rates. When rates go down, prices will likely go up. Our major chart illustrates this relationship.
CBOT 10-Year Treasury Notes Futures have a face value of $100,000 at maturity. The March 2026 contract (ZNH6) is currently quoting 112'240, equivalent to $112.75. Buying or selling one contract requires an initial margin of $1,875.
The 10Y futures are one of the most liquid futures contracts in the world. According to CME Group data, trade volume on November 17th was 1,779,688 contracts. Open Interest (OI) is 5,748,386 contracts at market close. OI is notional term is $574.8 billion.
In the next three FOMC meeting cycles, the contract prices could go either way depending on how the Fed votes. However, as soon as the President nominate his Fed Chair candidate, Treasury prices would get a big boost as the market will price in the new and lowered expected interest rates.
Hypothetically, if ZNH6 moves up 1% to $113.8775, the $1.1275 price gain would translate into $1,127.5 for a long futures position, given each dollar gain in price quotation equals $1,000 per contract. Using the initial margin of $1,875 as a cost base, the trade would produce a theoretical return of 60.1% (=1127.5/1875).
The long futures position will lose money if the Fed puts rate cuts on hold, and the new Fed Chair candidate is not announced in the next three months.
Happy Trading.
Disclaimers
*Trade ideas cited above are for illustration only, as an integral part of a case study to demonstrate the fundamental concepts in risk management under the market scenarios being discussed. They shall not be construed as investment recommendations or advice. Nor are they used to promote any specific products, or services.
CME Real-time Market Data help identify trading set-ups and express my market views. If you have futures in your trading portfolio, you can check out on CME Group data plans available that suit your trading needs tradingview.com/cme/
ZN1!)Since hitting an all-time high (ATH) of 48,431 on November 12th, the Dow Jones Industrial Average lost 1,841 points, or -3.8%, to 46,590 on Monday.
Meanwhile, the Nasdaq Composite has lost over 1,300 points, or -5.5%, from its ATH of 24,020. The S&P 500 is down 250 points, or -3.6%, from 6,920. Both the Nasdaq and the S&P reached their ATH on October 29th.
Cryptocurrencies have been harder hit than stocks. Today, Bitcoin prices dropped below $90,000, a whopping 29% drawdown since the King of Crypto hit ATH of $126,080. An entire year of gains has been erased.
Two key market forces are driving the US stock market downtrend.
Firstly, Wall Street grew worried about the AI bubble bursting. Earlier this month, “Big Short” investor Michael Burry grabbed headlines after his Scion Investment’s 13F filing showed bearish bets on Nvidia (NVDA) and Palantir (PLTR). Last week, Softbank offloaded all 32.1 million shares of NVDA it held. This is followed by Peter Thiel’s hedge fund, which sold off all 537,742 shares of NVDA on Monday.
On my October 27th commentary, I discussed that heavy exposure in High Tech stocks (64%) made Nasdaq very venerable. The Dow could weather the downturn better with a lower weight (21%). The recent market trend resonates with my theory.
Secondly, the Federal Reserve has turned hawkish on monetary policy. The Fed made the last rate cut on October 29th, without the aid of updated economic data due to US government shutdown. Fed officials have warned that further rate cuts are not a sure thing if new data does not support policy easing.
On October 27th, the odds for a December cut were 98.5%, according to data from the CME FedWatch tool. Today, it went down sharply to just 57%. Not cutting has the same effect as raising expected interest rates, which tends to drive down stock valuation.
cmegroup.com/markets/interest-rates/cme-fedwatch-tool.html
The Future is Less Uncertain than the Present
In my view, the market obsession with what the Fed Chair says day by day is overblown. Anybody remember a quote from Alan Greenspan? While modeling short-term decisions into long-term trends, we risk overlooking the impact from changing of guards at the Fed.
The current Fed Chair’s term will end in May 2026. Between now and then, there are four FOMC rate-setting meetings: December 9-10, 2025, January 27-28, March 17-18 and April 28-29 in 2026. What could possibly happen in four meetings:
• If the Fed is hawkish and refuses to cut rates, the policy Fed Funds rate could stay at the current 375-400 bp range.
• If the Fed turns dovish and cut 25bp every time, Fed Funds could be at 275-300 bp.
In recent meetings, the Fed no longer had consensus in its policy votes. Each decision is like a toss-up. If we only focus on the short term, trading results could be very volatile.
The next Fed Chair will be nominated by President Trump and confirmed by the Senate. We know for a fact that the President favors aggressive rate cuts to support the economy. Only someone who is 100% in agreement with the President could get nominated.
Latest news indicates that five candidates have made it to the final list to be considered for a Fed Chair nomination. They are Michelle Bowman, Christopher Waller, Kevin Warsh, Kevin Hassett and Rick Rieder.
If the Senate confirmation gets delayed, the President could pick a current Fed governor as Acting Chair. Whoever that may be, he or she will have to align with the President in terms of the direction of monetary policy. Gone with the independent central bank.
Even though we have no idea what happens next month, we could still form a good estimate of what the Fed will do in the next 2-1/2 years, starting in June 2026.
In my opinion, the expected policy rate will eventually go down to 1.0-1.5%, or even lower. This is not what the Fed currently says. Instead, I am forming an opinion based on a new Fed regime with a new Chair and multiple Fed governors supporting rate cuts.
With that in mind, we can now discuss trade strategies going beyond the next Fed meeting. We don’t have to wait a long time for everything to move in places. Once a new Fed Chair candidate is announced, the market will start pricing a different interest rate trajectory. Latest news suggests that the President may be meeting with three candidates after the Thanksgiving holiday.
Trading with 10 Year T-Notes Futures
As I mentioned earlier, US stocks have the risk of AI bubble bursting. We could wait a while to see how things play out. My trade idea today is a pure play on interest rates.
We know that Treasury prices are negatively correlated with interest rates. When rates go down, prices will likely go up. Our major chart illustrates this relationship.
CBOT 10-Year Treasury Notes Futures have a face value of $100,000 at maturity. The March 2026 contract (ZNH6) is currently quoting 112'240, equivalent to $112.75. Buying or selling one contract requires an initial margin of $1,875.
The 10Y futures are one of the most liquid futures contracts in the world. According to CME Group data, trade volume on November 17th was 1,779,688 contracts. Open Interest (OI) is 5,748,386 contracts at market close. OI is notional term is $574.8 billion.
In the next three FOMC meeting cycles, the contract prices could go either way depending on how the Fed votes. However, as soon as the President nominate his Fed Chair candidate, Treasury prices would get a big boost as the market will price in the new and lowered expected interest rates.
Hypothetically, if ZNH6 moves up 1% to $113.8775, the $1.1275 price gain would translate into $1,127.5 for a long futures position, given each dollar gain in price quotation equals $1,000 per contract. Using the initial margin of $1,875 as a cost base, the trade would produce a theoretical return of 60.1% (=1127.5/1875).
The long futures position will lose money if the Fed puts rate cuts on hold, and the new Fed Chair candidate is not announced in the next three months.
Happy Trading.
Disclaimers
*Trade ideas cited above are for illustration only, as an integral part of a case study to demonstrate the fundamental concepts in risk management under the market scenarios being discussed. They shall not be construed as investment recommendations or advice. Nor are they used to promote any specific products, or services.
CME Real-time Market Data help identify trading set-ups and express my market views. If you have futures in your trading portfolio, you can check out on CME Group data plans available that suit your trading needs tradingview.com/cme/

Jim W. Huang, CFA
jimwenhuang@gmail.com
climatehedge.net
jimwenhuang@gmail.com
climatehedge.net
Wyłączenie odpowiedzialności
Informacje i publikacje nie stanowią i nie powinny być traktowane jako porady finansowe, inwestycyjne, tradingowe ani jakiekolwiek inne rekomendacje dostarczane lub zatwierdzone przez TradingView. Więcej informacji znajduje się w Warunkach użytkowania.
Jim W. Huang, CFA
jimwenhuang@gmail.com
climatehedge.net
jimwenhuang@gmail.com
climatehedge.net
Wyłączenie odpowiedzialności
Informacje i publikacje nie stanowią i nie powinny być traktowane jako porady finansowe, inwestycyjne, tradingowe ani jakiekolwiek inne rekomendacje dostarczane lub zatwierdzone przez TradingView. Więcej informacji znajduje się w Warunkach użytkowania.