BTCUSD: Bearish Logscale Butterfly with Bearish RSI DivergenceJul 18, 2025:
Bitcoin has been setting up at the log adjusted 1.902 HOP for a Type 2 retest of the Logscale Bearish Butterfly for the last few months but recently pushed a bit above it and appears to be settling at the linear 1.902 HOP of the local price around the $118,000 area. Between $104,000 and $118,000 is a zone of linear of logscale Fibonacci confluence pointing towards the being the area to look for a more major downside reaction than we got off the initial Type 1 Reaction 1.618 PCZ re
Bearish Butterfly
The Bullish and Bearish Cases For ETH/USDOverview:
This idea contains both bullish and bearish cases for ETH/USD.
Bullish Case:
ETH/USD has formed a bullish pennant since April 8th. A strong break above the pennant's upper line indicates further upward momentum. The probability of success for a bullish pennant is roughly 54%.
Bullish Case Warning:
Although the bullish pennant is formed, there is a chance the price breaks below its bottom line, which would invalidate it. The bullish pennant is also accompanied by bearish RSI d
Bearish Logscale Butterfly T2 with Bearish MACD & RSI DivergenceBitcoin appears to be set up at the 1.902 HOP for a Type 2 retest of the Logscale Bearish Butterfly that resulted in a major Type 1 reaction from the 1.618 Fibonacci Extension back in 2021, where it dropped from $69,000 to $15,500 over the course of several months before ultimately bottoming at the PCZ of a smaller Log Scale Bullish Butterfly which signaled the Type 2 run up to the 1.902 HOP of the Bearish Butterfly where it is now. As it tests this level the MACD and RSI are both Diverging
Technical Analysis: EURNZD Bearish ButterflyHello Traders,
Below is my Technical Analysis of EURNZD.
EURNZD has formed a bearish butterfly pattern with points X: 1.79369, A: 1.7442, B: 1.78702, C: 1.76273, D: 1.80786. The current price is 1.80379. Expectation for a drop to 1.78808 in the coming weeks. Additionally, a bearish divergence is noted on the Awesome Oscillator, indicating weakening bullish momentum.
Cheers and Happy Trading.
NZDUSD Strategy 1 Trade Plan There was a Bullish trend, forming the bearish harmonic pattern also have bearish divergence.
Now, trend changed printed the LL, there is continuation pattern of bearish flag.
We take entry (Sell Stop) at the breakdown of the pole i.e. 0.61570 and keep our Stop loss above the LH once it will get mature near 0.61954 according to Fib Retracement of 38%.
GBPUSD: A Cautionary Tale of Potential Bearish PatternsWhile the daily chart shows a potential Bearish Butterfly Pattern, my experience suggests this might not play out as expected - or it could be a significant warning sign for traders.
If you're considering shorting GBPUSD, I'd recommend a type 2 retest on the Bearish Deep Gartley Pattern at 1.2756 as a more reliable entry point.
Share your thoughts and trade plans for GBPUSD in the comments below!
Weak Bull Formation and Short-Term Buy/Sell OpportunitiesEURUSD presents a potential shorting opportunity with the Bearish Butterfly Pattern on the 4-hourly chart at 1.1045. This aligns with the backdrop of a weaker bull trading setup observed on its Weekly chart.
For those seeking a buying opportunity, consider monitoring the 1-hourly chart at 1.0993, where a potential support trading setup might offer an entry for bullish positions.
What's your analysis or stance on EURUSD? Share your thoughts below!
Weekly Marubuzu Candle & Hourly Bearish PatternsNZDUSD presents a Bearish Butterfly Pattern on the Daily Chart, tempting many traders to consider shorting.
However, a note of caution: ensure the candle breaks and closes above the PRZ (red box) for confirmation before proceeding.
My strategy leans towards prudence, awaiting further validation through the Bearish Shark Pattern on the 1-hourly chart at 0.6219.
This approach not only reduces risk but also offers better returns, granting additional confirmation before entering the trade.
Wha
USDJPY: 3 Line Strike at the PCZ of a Bearish BatSimilarly to around the same time last year when USDJPY was at these levels, it had developed a 3 Line Strike at the PCZ of a Bearish Harmonic, and if it goes like last year, this will result in at least a few months of downside on this pairing.
There is also some Bearish Divergence formed on the RSI at this level.
Additionally, there is a much bigger Macro Bearish Butterfly setup that can be seen here:
Mth-long Consolidation for Profits
GBPUSD currently exhibits a Weaker Buy signal, accompanied by a 5-week long consolidation phase.
Trading Decision Dilemma:
The month-long consolidation prompts a crucial decision: Will it be a buying or selling opportunity?
Buying Opportunity:
For those inclined towards a buying stance, watch for the completion of the Bullish Butterfly Pattern at 1.1951 for a potential entry.
Aggressive Selling Approach:
Traders seeking a more aggressive move may consider the Bearish
Warning Signs Amidst the Bullish Trend
The overall trend on GBPUSD continues to be bullish, making it an attractive option for buyers.
Long Trade Scenario:
Daily Chart: A potential Bullish Shark Pattern nearing completion at 1.1937 suggests a buying opportunity.
Short Trade Considerations:
Personally, I'm inclined towards a shorting opportunity. Two potential setups catch my attention:
1-hourly chart: A key resistance level at 1.2174.
Daily Chart: A Bearish Butterfly Pattern may complete at 1.2244.
I
EURUSD: Potential to Extend Bearish Targeting Down to $0.83This is an update and continuation of this previous setup:
EURUSD has reached the full target of the Bearish Butterfly it formed a few months ago and is now sitting below the lows of the range and is back below the macro trend line. There are a few options one can go with now: take full profits, take partial profits, or hold for a macro break down to the big levels below 1 dollar as it goes for a Type 2 Return, which in this case is the Gartley PCZ between 99-98 cents and the Gartley HOP leve
COSTCO: Bearish Butterfly with PPO and MACD Bearish DivergenceCostco has formed a Bearish Butterfly that lines up with the 0.786 retrace and is testing the zone for the second time with PPO Bearish Confirmation Arrows on both tests, PPO Bearish Divergence, and MACD Hidden Bearish Divergence. This looks like it could be setting up to revisit the lower half of the range.
EURJPY: Bearish Butterfly with PPO Confirmation and DivergenceEURJPY is trading at the HOP level of a Bearish Butterfly while Bearishly Diverging on the MACD and printing a Bearish PPO Confirmation Circle just a few days ago as it broke the 21-day SMA. If it continues on this path, I'd expect the EURO to lose most if not all of the 2023 gains it's made against the Japanese Yen.
Shorting Opportunity Alert on EUR/USD!🐻 Weekly Chart: The overall setup on EUR/USD points to a Weaker Bear trend. 📉 This means there's potential for downward movement in the coming weeks.
⏳ Patience is Key: While we wait for the perfect entry point, keep a close eye on the lower timeframes for a shorting opportunity. 🧐
📈 Lower Timeframes: Look for price action signals and confirmation on the lower timeframes to pinpoint the ideal entry point for your short trade. 🎯
📉 Set Your Stop-Loss: Always remember to set a proper stop-loss t
QQQ: Looking Out for a 20-40% Pull BackThe NASDAQ100 is currently sitting at the 0.886 and 1.618 PCZs of big Bearish Shark and Bearish Butterfly patterns as the indicators hover around the overbought zones; we don't exactly have much confirmation yet that these PCZs will hold, but it seems like it wouldn't be a bad idea to position against the QQQ early on via some SQQQ monthly calls and perhaps getting Bearish on some of the top stocks within the index such as NVDA, TSLA, and MSFT.
Being conservative, I will only be looking for it
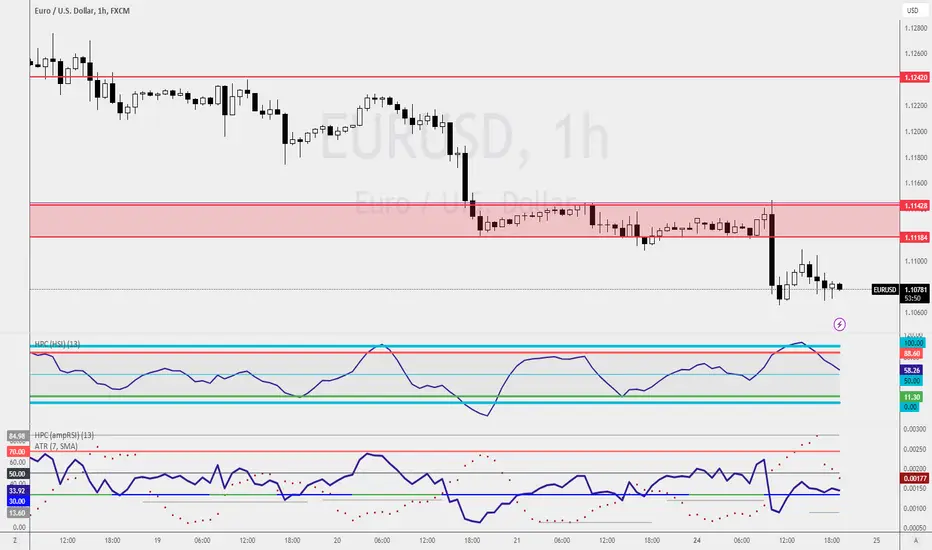
Still Looking to Short!⏳ This week marks my last opportunity to go short on EURUSD. The Weekly Chart shows a violation of structure, forming higher highs and higher lows.
🦋 A Bearish Butterfly setup is visible on the Daily Chart, pending confirmation with a candle close at 1.1195 or below.
💪 Aggressive traders, like me, may choose to wait for a market retest to the previous resistance at 1.2420 on the 1-hourly chart.
📊 Stay tuned for further updates and trading insights!
#EURUSD #ShortOpportunity #BearishButterfly
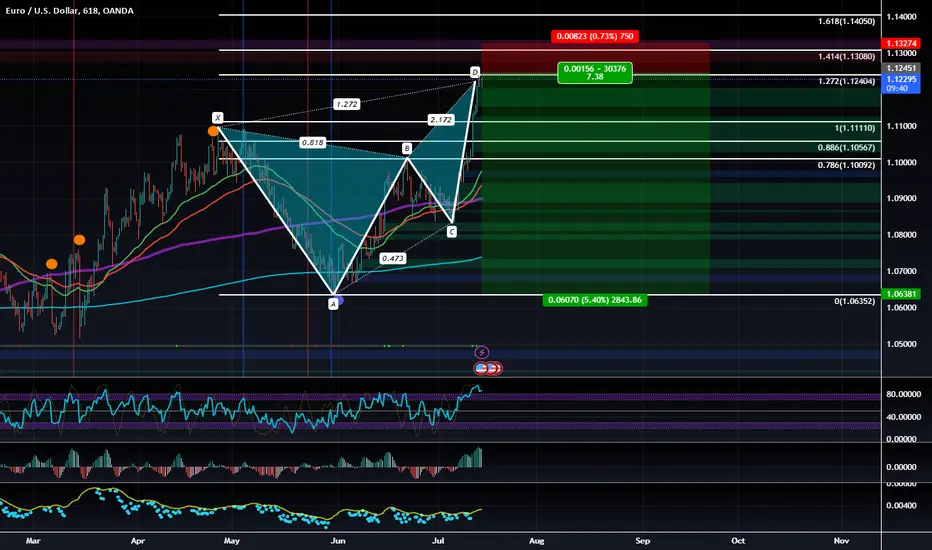
EURUSD: Bearish Reentry with a Potential Bearish ButterflyThe previous .786 entry got stopped out at much lower prices with a tight stop and now we are showing potential for reversal again at the 1.272 Fibonacci Extension and PCZ of Potential Bearish Butterfly as the RSI goes well above the last overbought reading. Given the scenario, I'd say it's worth trying again with a stop above the next Fibonacci extension.
Nikkei 225: Bearish Divergence at Bearish Butterfly PCZThere is Bearish Divergence on both the RSI and MACD at the PCZ of a Bearish Butterfly, and there will hardly be any support until we reach the 1.618 Fibonacci Extension down at 18627JPY, but from the looks of it, it will likely be a very fast drop followed by an even faster recovery, but in the meantime the JPY could gain some strength.