BTCUSD: Bearish Retest Conditions and Invalidation RiskBTCUSD's four-hour weekend review favors a conditional bearish retest scenario: a recovery into 83554-84571 could encounter resistance and lead to another decline. This is preparation for the next session, based on completed-bar structure, rather than a current signal.
The chart shows a sharp decline through the former consolidation area, followed by a rebound that has not reclaimed the proposed resistance zone. The supplied profile identifies 83554-84571 as the largest volume shelf, containing
Bill Williams Indicators
What Is Stock Float, and Why Can It Move Prices Fast?Two stocks can attract the same amount of buying in a single session, yet one barely moves while the other jumps 20%, 30%, or more. One reason can be the stock's float.
Float isn't a prediction tool, and it doesn't tell you where a stock is going. It simply tells you how many shares are actually available for public trading. Understanding that number, and what it does and doesn't tell you, can be useful for understanding why some stocks can move much more aggressively than others.
📌 What Is F
SUI - Daily: VDS just flashed a SELLA solid VDS setup is developing on the SUI daily chart.
It’s not a perfect setup, but the majority of historical signals have been remarkably clean. The setup has managed to catch most of the major tops and bottoms on SUI, which makes the current signal worth paying attention to.
A new SELL signal has just appeared.
Considering the current state of the broader market, the signal looks well justified. Of course, VDS is not a crystal ball, and no single signal should be traded blindly. But wh
Complete Guide to MACD Strategy - Simple Accurate and ProfitableComplete Guide to MACD Strategy - Simple, Accurate, and Profitable Rules
A comprehensive and detailed guide explaining how to trade effectively using the Moving Average Convergence Divergence (MACD) indicator in alignment with overall market structure and price action.
Overview:
The MACD (Moving Average Convergence Divergence) is one of the most reliable momentum and trend-following indicators available to technical traders. While many beginner traders rely solely on generic indicator crosso
BCHUSDT — Bullish Divergence + Structure BreakBCHUSDT was previously trading in a clear bearish structure. A bullish RSI divergence then developed, with price forming a lower low while RSI formed a higher low, indicating weakening bearish momentum.
Rather than entering solely on the divergence, I waited for confirmation on the 1H timeframe. Price subsequently broke the previous lower high, signalling a potential shift in market structure.
After the 1H confirmation, I moved to the 15M timeframe for execution. The stop loss was positioned b
XAUUSD — Bullish Reversal After 1H Structure ShiftGold has remained in a bearish trend over the past few weeks. However, a bullish RSI divergence developed on the 1H timeframe, with price forming a lower low while RSI formed a higher low, signaling weakening bearish momentum.
The reversal gained confirmation after the previous lower high was broken, followed by a shift toward higher highs and higher lows.
My analysis was completed on the 1H timeframe, while execution was refined on the 15M timeframe using Bill Williams Fractals. The stop loss
ICPUSDT – Bullish SetupBullish bias identified on the 1H timeframe, using Heikin Ashi candles to better visualize trend direction and momentum by filtering out some of the market noise.
Entry was refined on the 5M timeframe, waiting for a pullback/retest into the Alligator lip, followed by bullish candle confirmation.
EP: 3.327
SL: 3.229
TP Alert: 3.427
Published on the 1H chart due to TradingView publication timeframe restrictions; actual execution was taken on the 5M.
XRPUSDT Perpetuals — Bearish Bias Pullback EntryMy analysis of the 1 hour chart established a bearish bias, and I used the 5 minute chart to time my short entry.
I waited for price to pull back and retest the lip. Once a bearish confirmation candle appeared, I entered a short position in line with the higher timeframe trend.
Trade levels:
• Entry: 1.4722
• Stop-loss: 1.4918
• Take-profit: 1.4542
The approach was simple: establish the overall direction, wait for the retracement, and enter after confirmation.
The chart shown is the 1 hour c
GOLD (XAUUSD) Bearish Re Distribution Setup 📊 TECHNICAL ANALYSIS: Re-Distribution Continuation Setup on Gold (XAUUSD)
Market has paused its downward movement to form a clear Re-Distribution phase. Volume Spread Analysis (VSA) indicates that smart money is building fresh sell positions during consolidation to continue the dominant bearish trend.
🔑 VSA & TECHNICAL INDICATORS:
Re-Distribution Phase: Weak bounce attempts on low volume confirming a complete lack of buying demand.
Volume Spread Analysis: High-volume rejection at lower highs
BTWUSDT Perpetuals 1H Analysis 5M ExecutionMy analysis on the 1 hour chart gave me a bullish bias. I then moved to the 5 minute chart to look for an entry.
I waited patiently for a pullback. After three consecutive bearish candles, a bullish confirmation candle appeared, giving me the signal to enter a long position.
My trade levels:
• Entry: 1.22031
• Stop-loss: 1.20398
• Take-profit: 1.23664
The focus of this setup was patience: establish the higher timeframe direction, wait for a pullback, and enter after confirmation.
POLUSDT LONG: Bullish Setup | 1H Analysis 15M EXECUTIONMy bullish bias comes from the recent 1 hour price structure, where higher highs and higher lows suggest that buyers remain in control. The Williams Alligator supports this view, with its lines aligned upwards and spreading apart.
For execution, I dropped to the 15 minute timeframe and waited for a pullback. Once a bullish candle appeared following the retracement, I entered long, looking for continuation in the direction of the higher timeframe trend.
Trade levels:
- Entry: 0.11687
- Stop-lo
USDT dominance may be approaching a turning pointUSDT Dominance (USDT.D) is widely used to gauge the direction of the broader crypto market. Most traders analyze it through technical patterns, support/resistance, trendlines, and other forms of classic TA.
Sometimes they work. Sometimes they don’t.
So I decided to run USDT.D through my VDS (Volume Divergence Scanner) with a configuration specifically adapted to this asset.
And the result is pretty damn interesting.
Yes, there is some noise on the 6H timeframe. But most of the signals app
AUDCHF | 1H Analysis 15M Execution Bullish Divergence SetupAUDCHF has been in a downtrend, forming lower highs and lower lows. However, the latest lower low in price was accompanied by a higher low on the RSI, creating bullish divergence and suggesting that selling momentum may be weakening.
I entered long after price broke above a recent minor lower high, looking for a potential recovery within the broader downtrend. I used the Bill Williams Fractals indicator to help identify a recent swing low and placed my stop loss beneath it.
The plan is to take
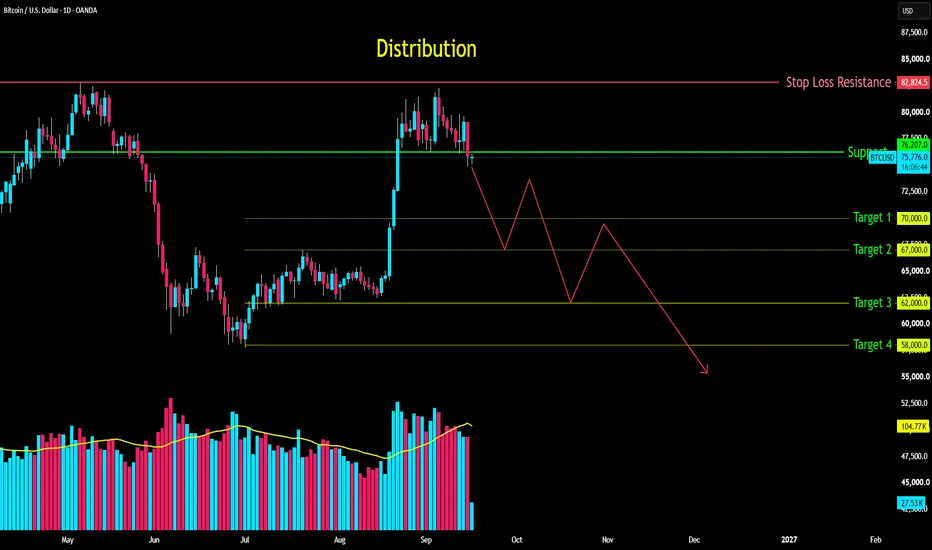
BTC: Wyckoff Distribution Setup Markdown Expected📊 TECHNICAL ANALYSIS: Institutional Distribution Setup On (BTC)
Bitcoin (BTC) is forming a classic Wyckoff Distribution range following an extended markup smart money is actively shifting supply to retail buyers near the range highs signaling an upcoming markdown.
🔑 VSA & TECHNICAL KEY LOGIC:
Structure Distribution Top / UTAD confirmed
Volume Decreasing buying volume on highs with rising volume on bearish candles indicating institutional selling pressure.
🎯 TRADE SETUP & Execution Plan:
ENAUSDT | Bullish Continuation SetupENAUSDT has shown strong bullish momentum on the 1 hour chart, with price trading above the Williams Alligator lines and maintaining a positive market structure. Following the sharp upward move, price consolidated near the entry zone while the RSI remained bullish, with no clear bearish divergence visible.
The overall analysis was completed on the 1 hour chart, while the trade was executed on the 15 minute chart after lower time frame confirmation.
Trade plan:
- Entry:0.20259
- Take profit:0.
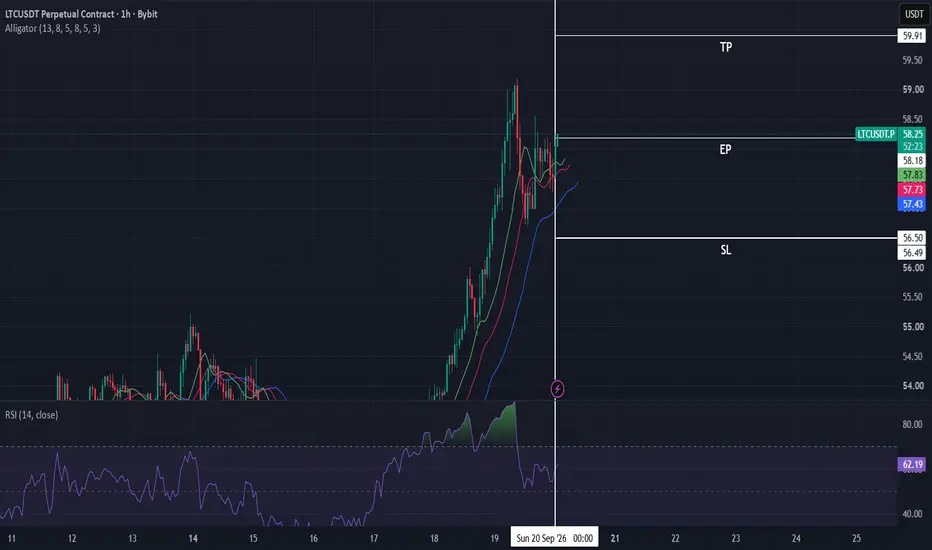
LTCUSDT | Trend-Following Long SetupLTCUSDT remains in a clear uptrend, supported by a consistent sequence of higher highs and higher lows. My overall analysis was completed on the 1 hour chart, where the bullish market structure remained intact and no bearish RSI divergence was present.
For execution, I moved to the 15 minute chart and waited for price to complete a pullback and form a higher low. A strong bullish confirmation candle then signaled renewed buying pressure and provided the trigger for my long entry.
The trade pla
QQQ Technical Outlook: Critical Price Levels, Support Resistance📊 QQQ TECHNICAL OUTLOOK
Critical Price Levels • Support • Resistance • Price Structure
⚡ KEY LEVELS AT A GLANCE
🔴 721.86–724.13 MAJOR RESISTANCE | 🔴 718.00–720.00 RESISTANCE | 🟢 713.00–715.00 SUPPORT | 🟢 709.00–712.00 SUPPORT | 🟣 700.00–705.00 MAJOR SUPPORT
QQQ is trading at an important technical junction following Thursday's strong rebound. The immediate question is no longer simply whether momentum is bullish or bearish.
The key is how price reacts at these clearly defined levels.
🔴 718.00–
ZEC VDS LONG SetupI’ve been asked a few times to take a look at ZEC and tune VDS for it, so I finally did.
I configured VDS specifically for LONG (BUY) setups on the 4H timeframe.
ZEC is currently in an uptrend, and the SELL signals are still too noisy to be useful. So for now, I’m intentionally focusing only on BUY setups.
On higher timeframes, there simply isn’t enough history yet to build a setup I’d consider reliable.
One thing I find interesting is that the signals become noticeably cleaner as more his
XLMUSDT - BEARISH DIVERGENCE - SHORT POSITIONAnalysis completed on the 1 hour timeframe, with execution on the 15 minute timeframe.
The 1H chart shows bearish RSI divergence, with price making a higher high while RSI makes a lower high, suggesting weakening bullish momentum.
I used a combined indicator incorporating Bill Williams’ Alligator, Fractals, and Resistance/Supply zones to guide trade execution and stop loss placement.
Trade levels (USDT):
- Entry: 0.1921
- Stop-loss: 0.1961
- Take-profit: 0.1886
- Intended risk-to-reward: 1:1