Bakersfield California: the Cup of Life for Tejon RanchTejon Ranch, a large swath of land just south of Bakersfield, CA has big plans for developing properties along the I-5 corridor. It is a prime location between LA and Bakersfield.
The rate at which CA is putting up housing and expanding the American Suburb is astonishing and there is no reason Tejon Ranch cannot gobble up some of that revenue.
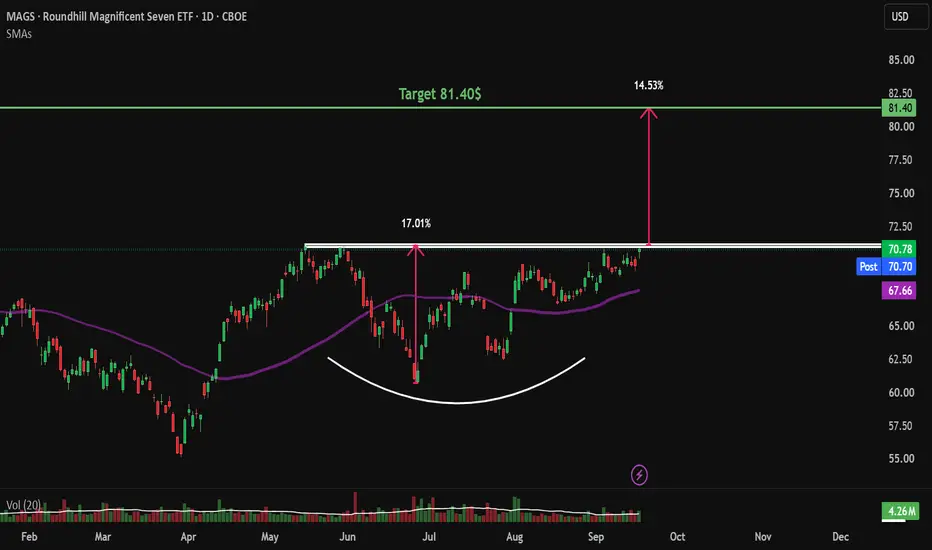
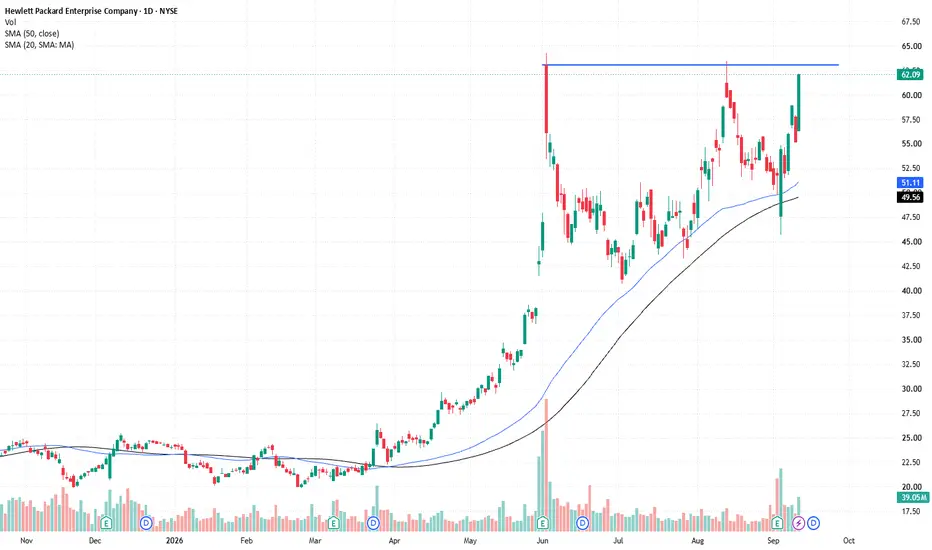
The chart shows a potential cup with handle pattern, but we will have to wait to see if the handle breaks through the rim of the cup. Even if the cup pattern fails this could be a long-term investment opportunity thanks to the location of Tejon Ranch.
Cheers
EDIT: the image in the chart does not appear to showing up. It is a map of Tejon Ranch as produced by the company itself.
Cup And Handle
Cup & Handle in progress after long term downtrendNSE:SAREGAMA is forming Cup & Handle after long term downtrend.
Good fundamental & recent addition by Promoter is a plus. Long term view is bullish.
Good candidate for long term accumulation.
Note : I am sharing my general view. Not a buy sell recommendation.
UNP Massive Neckline TestNYSE:UNP โ Knocking on the door of all-time highs
Union Pacific has quietly built one of the strongest long-term uptrends in the market. After reclaiming the rising 200 EMA earlier this year, the stock has been riding the 20 EMA higher with a series of shallow, healthy pullbacks. Lots of unusual options flow in this name as well. Trump mentioned railroad projects a while back. Definitely some congressional buys.
What stands out:
* ๐ Strong EMA alignment (8 > 20 > 50 > 200)
* โ
Rising 200 EMA confirms the primary trend
* ๐ Every test of the 20 EMA has attracted buyers
* ๐ฏ Price is now challenging the $276-278 resistance zone near all-time highs
A decisive breakout above this level could open the door to a fresh leg higher. If resistance holds, Iโd be looking for another controlled pullback into the rising 20 EMA rather than chasing strength.
This is exactly the type of chart I like to see: higher highs, higher lows, and institutions defending trend support instead of allowing deep retracements.
ACIW - Clean cup & handle breakoutWhy I like ACIW
- Right theme, right time: it's an in-theme leader in digital payments (IPAY), the freshest early-curl theme on the board right now, so it's got rotation wind at its back.
- Confirmed base breakout: daily cup and handle breaking out with all the MAs reclaimed, price back above the cloud and 50-day. That's a real structural turn, not just a bounce.
- Momentum agrees: MACD crossed up and expanding above zero, so the breakout has thrust behind it.
- Stronger than its own basket: ACIW is in clearly better shape than IPAY itself, which means it's one of the names actually dragging the theme's RS up, exactly the leader we went fishing for.
- Clean risk map: well-defined handle low (~42-43) to lean on and a measured move that points to the 58-60 highs, so the reward-to-risk is real once we get an entry.
- The only knock is timing, not thesis: it's extended ~14.5% above the 50-day, so it's stretched here. That makes it a "wait for the pullback or flag," not a pass.
I like the trade, I just don't like the price right this second. I also question its ability to really run: I like stocks that double and triple, and this one could deliver underwhelming returns. In any case, a good study in charting and perhaps I am discounting the potential.
Technical Confluence at Its Finest | 3 Explosive PatternsOne of my favorite technical concepts is reversal pattern confluenceโwhen several bullish formations develop within one another, all pointing toward the same outcome.
PACS is currently one of the cleanest examples I've seen.
After reaching an all-time high near 44 in October 2024, the stock suffered a sharp decline and spent more than a year quietly accumulating. That long period of sideways action eventually carved out the Cup portion of a much larger Cup & Handle pattern.
The story changed in November 2025, when bulls woke up aggressively, triggering a powerful breakout from the accumulation base and driving price back toward the all-time high.
Instead of another sharp selloff, however, the stock entered a healthy correction, forming a Bull Flag (descending channel)โa classic continuation pattern. The breakout from that flag was successful, and the current pullback appears to be nothing more than a retest of the breakout, which is often a constructive sign.
As if that wasn't enough, the Bull Flag breakout and subsequent retest have now evolved into a well-defined Inverse Head & Shoulders pattern just below all-time high resistance. This creates another layer of bullish confluence just before a potential breakout.
Why this setup stands out
Rather than relying on a single pattern, PACS is showing multiple bullish structures nested within each other:
โ
Large Cup & Handle
โ
Bull Flag breakout and successful retest
โ
Inverse Head & Shoulders just below resistance
When several independent bullish patterns point in the same direction, the probability of a successful breakout generally improves.
If the 44 ATH resistance finally gives way, the stacked bullish confluence could unleash a powerful breakout, with each pattern projecting its own upside objective:
๐ฏ Inverse Head & Shoulders: ~55
๐ฏ Bull Flag: ~69
๐ฏ Cup & Handle: ~80 (long-term objective)
These are measured technical objectivesโnot guaranteesโand price may consolidate or pause before reaching each level.
Invalidation
The nearest setup is the Inverse Head & Shoulders, so I will use its invalidation level for risk management.
A daily close below 33 (the right shoulder low) would invalidate the current bullish thesis and suggest that buyers have lost control.
Sometimes the strongest trades aren't based on a single patternโthey emerge when multiple bullish structures align at the same location. PACS is a textbook example of technical confluence, making it a stock worth keeping on the watchlist over the coming weeks.
๐ This is where technical analysis gets interesting. Multiple bullish patterns point higher, but price must still prove itself. Let's watch together whether this becomes another Top & Drop or the breakout that validates them all.
Dollar Dollar Baby - $DxyFound an interesting pattern on the dollar's chart.
Now, admittedly, I have never done much technical analysis on TVC:DXY before but I can't ignore a cup and handle when I see one.
I can't do a full write up today but I just wanted to share my levels on the ticker. It is intended to use as a thermometer for the market's bear/bull sentiment.
Wouldn't it be a doozy, if this thing actually hit $120?
$UPST - 50 SMA Breakout and Cup and Handle Pattern๐ก Swing setup idea
Cup and handle completion
๐ Analysis summary:
The stock is crossing above the 50 SMA and closing a cup and handle pattern. We are seeing above-average buyers volume stepping in to support the move.
๐ Levels to watch:
Entry trigger: Break above $35.19
Target: $45.87
Stop: Under the breakout level
๐ฌ What do you think of this setup? Let me know in the comments! ๐
Good luck!
โ ๏ธ Note: This is for educational purposes only and is not financial advice.
8386 - 5 months CUP & HANDLEโโโโโโโโโโโโโโโโโโโโโโโโโโโโโโ
Since 2014, my markets approach is to spot
trading opportunities based solely on the
development of
CLASSICAL CHART PATTERNS
๐คLetโs learn and grow together ๐ค
โโโโโโโโโโโโโโโโโโโโโโโโโโโโโโ
Hello Traders โ
After a careful consideration I came to the conclusion that:
- it is crucial to be quick in alerting you with all the opportunities I spot and often I don't post a good pattern because I don't have the opportunity to write down a proper didactical comment;
- since my parameters to identify a Classical Pattern and its scenario are very well defined, many of my comments were and would be redundant;
- the information that I think is important is very simple and can easily be understood just by looking at charts;
For these reasons and hoping to give you a better help, I decided to write comments only when something very specific or interesting shows up, otherwise all the information is shown on the chart.
Thank you all for your support
๐๐๐ ALWAYS REMEMBER
"A pattern IS NOT a Pattern until the breakout is completed. Before that moment it is just a bunch of colorful candlesticks on a chart of your watchlist"
โโโโโโโโโโโโโโโโโโโโโโโโโโโโโ
โ DISCLAIMER โ
The content is The Art Of Charting's personal opinion and it is posted purely for educational purpose and therefore it must not be taken as a direct or indirect investing recommendations or advices. Any action taken upon these information is at your own risk.
$UBER - Triple Bottom and 50 SMA Cross๐ก Swing setup idea
Watchlist setup
๐ Analysis summary:
Another great, high potential watchlist setup for the week. The stock crossed above the 50 SMA and is currently making a triple bottom pattern.
๐ Levels to watch:
Entry trigger: Break above $78.76
Target: $88.70
Stop: Under the breakout level
๐ฌ What do you think of this setup? Let me know in the comments! ๐
Good luck!
โ ๏ธ Note: This is for educational purposes only and is not financial advice.
$JPM - 50 SMA Cross and Cup Structure๐ก Swing setup idea
Watchlist setup
๐ Analysis summary:
The stock crossed above the 50 SMA and closed a cup structure. This is a great setup to add to your watchlist and keep an eye on for a potential breakout.
๐ Levels to watch:
Entry trigger: Break above $337.25
Target: $395.36
Stop: Under the breakout level
๐ฌ What do you think of this setup? Let me know in the comments! ๐
Good luck!
โ ๏ธ Note: This is for educational purposes only and is not financial advice.
$PNFP - Big Cup and Handle and 50 SMA Breakout๐ก Swing setup idea
Bullish breakout
๐ Analysis summary:
The stock crossed above the 50 SMA, closing a big cup and handle pattern. Buyers' volume is stepping in, showing strong momentum supporting the move.
๐ Friendly reminder: The broader market is currently trending down, so please keep market weakness in mind before entering any new trades.
๐ Levels to watch:
Entry trigger: Break above $101.41
Target: $121.58
Stop: Under the breakout level
๐ฌ What do you think of this setup? Let me know in the comments! ๐
Good luck!
โ ๏ธ Note: This is for educational purposes only and is not financial advice.
CUP AND HANDLE BREAKOUT IN AMANTA-- EDUCATIONAL PURPOSENot much data available on chart as it is listed in Sept 2025.
Since listing it was continuously in down trend till March 2026, then price started to rise and it crossed the previous high formed at the time of listing and successfully closed above it in 1st week of this month. It also sustained above that level for 2 weeks. Now long position can be initiated at re test level near 145 with expectation of the rally to continue and extend it till 270
TARGET : 270 (86%)
Stop loss : 114 (-21%) On weekly closing basis
RR ratio : 1:4
Time Horizon : 3 years (till July 2029)
ONLY FOR LONG TERM INVESTING PURPOSE
NOT FOR SHORT TERM TRADING
$DHR - 50 SMA Breakout and Cup and Handle Pattern๐ก Swing setup idea
50 SMA breakout / Cup and handle formation
๐ Analysis summary:
The stock crossed above the 50 SMA and is currently forming a cup and handle pattern. We are also seeing rising, above-average buyers volume supporting the move.
๐ Levels to watch:
Entry trigger: Break above $189.21
Target: $217.42
Stop: Under the breakout level
Friendly reminder: Always keep an eye on the broader market conditions and overall trend, as they can heavily influence individual stock setups!
๐ฌ What do you think of this setup? Let me know in the comments! ๐
Good luck!
โ ๏ธ Note: This is for educational purposes only and is not financial advice.
$ALLY - 50 SMA Breakout and Cup and Handle Pattern๐ก Swing setup idea
50 SMA breakout / Cup and handle formation
๐ Analysis summary:
The stock crossed above the 50 SMA and is currently forming a bullish cup and handle pattern.
๐ Levels to watch:
Entry trigger: Break above $47.06
Target: $58.16
Stop: Under the breakout level
Friendly reminder: Always keep an eye on the broader market conditions and overall trend, as they can heavily influence individual stock setups!
๐ฌ What do you think of this setup? Let me know in the comments! ๐
Good luck!
โ ๏ธ Note: This is for educational purposes only and is not financial advice.
NASDAQ INDEX (US100): Waiting For Breakout to Buy
NASDAQ Index formed a huge cup & handle pattern.
Its neckline is based on the current all-time high.
Your next strong bullish signal will be its breakout and a daily candle close above 30760.
Buy the market then, expecting a rise at least to 31200 level.
โค๏ธPlease, support my work with like, thank you!โค๏ธ
Paras Defence and Space Technologies Ltd Investment IdeaStock show a bullish momentum from with making higher high and higher low and breakout with rounding bottom pattern with good volume and RSI after breakout if it will sustain above the give retracement level it can go further more on the give target
Weekly TF
Rounding Bottom
Volume
The recent movement in Paras Defence is mainly driven by strong sentiment in defence and space sectors. India is focusing heavily on self-reliance in defence and increasing space-related investments. Companies involved in niche technologies like optics and space engineering are getting strong investor attention. Paras Defence also benefits from
Strategic contracts
High entry barriers
And limited competition Overall conclusion
This rally is driven by defence and space sector growth along with long-term policy support
$GIL - Double Bottom Breakout on Growing Volume๐ก Swing setup idea
Bullish Pattern
๐ Analysis summary:
The stock crossed above the 50 SMA, closing a pattern that resembles a double bottom or cup and handle.
We are seeing growing, above-average buyers volume stepping in, adding strength to the move.
๐ Levels to watch:
Entry trigger: Break above $62.00
Target: $70.51
Stop: Under the breakout level
๐ฌ What do you think of this setup? Let me know in the comments! ๐
Good luck!
โ ๏ธ Note: This is for educational purposes only and is not financial advice.