ARC: Weekly VCP, Daily Launchpad. ⚛️HTF Context 🔭
ARC is building one of the cleaner higher-timeframe structures on my watchlist.
The weekly chart has spent months repairing its prior decline, then established a series of higher lows and began compressing beneath the key $0.083 to $0.084 resistance area. Volatility has contracted, volume has faded during the base, and price is holding above the rising weekly structure.
This resembles the early-stage behavior seen in many prior large-cycle winners: an extended repair phase
Economic Cycles
Dynamic Structural AnalysisTraders eventually discover two structural concepts: swing structure and internal structure. What often gets missed is that these two are not separate tools used side by side — they are one continuous, repeating cycle, and understanding the cycle is what makes structural analysis dynamic rather than a fixed set of lines on a chart.
The Break Starts the Discovery
Once a swing high or a swing low breaks, price enters price discovery. That price discovery move is internal structure — its own tr
Ethereum History rhymesPrice is compressed in a tight range between roughly 2,350 and 2,550 after the September impulse, and the obvious move is a push through the highs that takes the breakout liquidity, fails, and reverses back inside. From there I expect the market to come down and reset the FVG left behind by the impulse, roughly 1,900–2,220. That's not a failure of the move, that's the move getting properly filled.
The rhyme: identical sequence in May–June 2025. Impulse off the 1,492 low, unfilled gap, weeks of
Gold 1H | The Market Is Asking a Question⏱️ Reading time: ~2 minutes
Sometimes, a chart is more than just a chart.
If we look at it too quickly, we may see nothing more than a few candles moving up and down.
But if we slow down...
another question begins to appear:
What exactly is the market building?
On the 1H Gold chart, the recent move from the 4,697 high has created a meaningful bearish structure, while the market is now developing a movement that has not yet revealed its final answer.
We can follow a bullish scenario, where
Episode 06 — When the Wave Principle Reached the World🎬 Mr. Nobody’s Chronicle
Season I — The History of Elliott Wave Principle
Episode 06 — When the Wave Principle Reached the World
“A discovery, while it remains only in one person’s mind, still has a long journey before it can reach the world...”
In the previous episode, we came closer to one of the deeper ideas behind the Wave Principle.
A movement could be composed of smaller movements...
while that same movement could also be part of a larger structure.
A pattern within the pattern.
But
AVO (Mission Produce): The Star Alignment Taking PlaceIf you are looking for a fundamentally backed breakout play hiding in plain sight, NASDAQ:AVO needs to be on your radar.
Looking at the daily chart, the price action over the last year has been incredibly choppy, trapped in a volatile range between $9.50 and $15.50. However, beneath this frustrating structural choppiness, a massive accumulation phase is taking place, backed by serious fundamental catalysts and heavy institutional conviction.
Here is why NASDAQ:AVO is positioned for a major
ENSO: 5H Balance Break, Retest Held, VAH Acceptance Next⚛️ Daily Chart 📈
The daily is the higher-timeframe roadmap here. As long as ENSO continues to hold its daily structure and avoids accepting back below the key breakout/support area, the 5H balance break has room to develop into a broader continuation move.
The 30m VAH is the immediate trigger, but the daily chart determines whether this is simply an intraday push or the beginning of a cleaner higher-timeframe expansion. A daily close holding above the breakout area would strengthen the bullish
BTC 2026 Bottom SnipingTarget circle of bear market end, derived from a combination of the four year cycle dogma for time, and my personal power law dogma for price (TV won't let me turn on the power law model for a published idea).
If the price action fails to hit the circle in time, I highly doubt BTCUSD will ever fall to those price levels again in the future.
I continue to see a higher low as the most likely marker of the end of the bear market. This higher low is a time-adjusted double bottom in my power law mo
CRWV Vs. NVDA: The "Shovel" vs. The "Mine"Why CoreWeave Offers the Higher Beta Upside IMHO!
Everyone knows NASDAQ:NVDA is the undisputed king of the AI revolution. They sell the shovels (GPUs) for the AI gold rush. But when a company reaches a multi-trillion-dollar market cap, the days of explosive, multi-bagger upside become mathematically constrained.
If you are looking for the next phase of alpha in the AI infrastructure supercycle, you have to look at the companies building the physical mines where those GPUs operate. Enter NAS
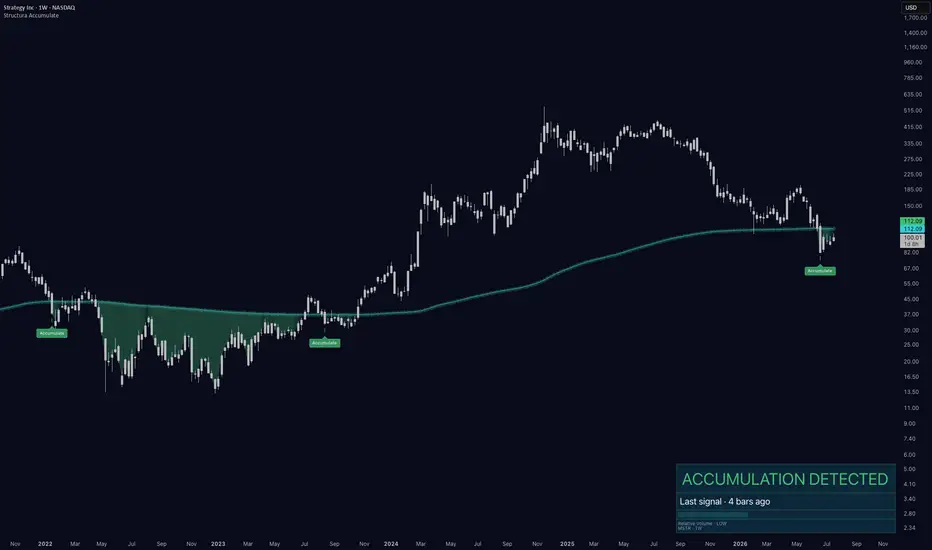
MSTR: First Accumulation Zone Since the 2022-2023 BaseFour weekly bars ago, Structura Accumulate marked a zone on MSTR - the first since the 2022-2023 base. Between those two zones: nothing. Through the entire advance, through every drawdown along the way - silence. That gap is the story.
What the last zone preceded
The 2022-2023 zone formed where MSTR was rebuilding structure after the crypto-winter decline - price consolidating around a long-anchored reference while attention on the name was minimal. What followed belongs to market history. A
What the Market Is Trading Now: AI Selectivity, Not AI EuphoriaMarkets barely moved at the index level this week — but that calm is misleading. The tape is telling a sharper story: capital is no longer paying for the AI theme as a bloc. It is paying for proof. Execution, demand visibility, and monetization timeline are the only things being rewarded, and everything else is being sold.
Our market-temperature model captures the split cleanly. The Nasdaq (IXIC) printed a TEMP10 of 69.35 — into defensive territory — while the S&P 500 (SPX, 80.06) and Dow (DJI,
NQ Weekly Outlook: Mixed & Choppy? | 7–11 SepThe Fringe Cycles model read for the coming week suggests a more alternating structure, with positive and negative biases switching through the week. The overall expectation is therefore for a potentially mixed and choppy environment, rather than a clean directional move.
This outlook is based on the NQ Globex session, not just regular cash-session price action. Each daily bias applies approximately from 18:30 Eastern on the previous evening through 15:30 Eastern on the stated trading day.
For
NZDJPY Daily – Bullish SetupHello Trading Fam! 👋
Price has pulled back into the lower bound/support zone after rejecting the upper range. If this support holds, I’m looking for a bullish move back toward the middle of the range and potentially higher.
Don’t forget to like and share your thoughts in the comments! ❤️
Silver 4H | The Structure Is Speaking — Elliott Wave Update⏱️ Reading Time: ~2 minutes
Silver remains at a critical structural point. Based on our previous analysis, the larger corrective structure may have completed Wave IV at the recent low, but the current price action still needs to prove whether a new bullish impulse is developing.
🟦 Scenario 1 — Bullish Case
The current advance can be interpreted as the beginning of a five-wave impulse. If this structure continues to develop with clear subdivisions and appropriate corrections, the next importan
Gold’s Structural Crossroad⏱️ Reading Time: ~3 minutes
The Daily Gold chart remains at a critical structural point. Based on the structures identified in our previous analyses, we are still tracking two primary scenarios.
🟦 Scenario 1 | Bullish Case
The bullish interpretation suggests that Wave IV may already be complete, and the current structure could be developing as the beginning of a new impulsive advance.
For this scenario to gain strength, price needs to continue building a clear five-wave impulsive structure.
Silver | When the Patterns Whisper⏱️ Reading Time: ~3 minutes
Following our previous analyses, Silver is now at a point where the current structure needs to prove itself. Two primary cases remain on the table, and their details may change as the structure develops.
🟦 Scenario 1 | Bullish Case
In this view, the recent move could be part of a five-wave impulsive structure. If the current wave continues with impulsive character, we would expect the corrections between waves to develop according to their degree and structural pos
Gold | When the Patterns Whisper, We Listen⏱️ Reading Time: ~3 minutes
The Daily Gold chart remains at a critical structural point. Based on the structures identified in our previous analyses, we are still tracking two primary scenarios.
🟦 Scenario 1 | Bullish Case
The bullish interpretation suggests that Wave IV may already be complete, and the current structure could be developing as the beginning of a new impulsive advance.
For this scenario to gain strength, price needs to continue building a clear five-wave impulsive structure.
Silver | Has Wave IV Ended, or Is One More Decline Still Ahead?⏱️ Reading Time: About 2 Minutes
🟦 Scenario 1 | Bullish Case
In the bullish scenario, Wave IV may have already been completed as a Zigzag, while Wave II of the same degree formed an Expanded Flat. This difference is consistent with the Elliott Wave guideline of alternation between corrective waves.
However, confirmation of a continuing bull market does not depend solely on higher prices. After each advance, the current structure should produce a clear and clean correction appropriate to its wa
Gold | The Waves Remember What Price ForgetsGold | When the Larger Waves Speak
⏱️ Reading Time: About 3 Minutes
From the major market low in 1999, Gold has developed a long-term bullish structure. The market is now at a point where the larger-degree wave structure becomes increasingly important.
At this stage, two primary structural interpretations remain under consideration.
🟦 Scenario 1: Bullish Case
The bullish scenario remains a structural possibility, but it has not yet received final confirmation until the previous all-time high
COIN — Macro range, retesting the floor COIN is back at 140-180 zone after a full round trip from the 2025 highs, and the only level that matters here is around 140 That shelf has been the base of the entire post-2024 range and has held every test since.
The template is the 2022–2023 base. Same shape: a long, boring range, months of no expansion, everyone bored out of the name, then a reclaim of the range high that ran three-plus times off the lows. What's forming now is the same structure one degree higher.
The correlation is the