Important Levels for Long Term #KPITTECHHey Folks!
I have marked all the Important levels for NSE:KPITTECH .
Use these levels with you analysis and experience.
What does this company do?
KPIT Technologies offers a wide range of software products and platforms aimed at the automotive and mobility industry, including solutions for autonomous driving, electrification, connected vehicles, diagnostics, and infotainment systems.
Economic Cycles
Bitcoin: First Impulse, Real Confirmation?This 4-hour Bitcoin analysis is based on the structural scenarios previously discussed on the higher timeframes and now focuses on the market's first potential impulsive move.
The recent advance from the marked area raises the possibility that Bitcoin is developing its first valid five-wave impulsive structure. If this count remains consistent with the rules and guidelines of the Elliott Wave Principle, it could become the first important structural evidence supporting the bullish scenario.
Ho
NQ Weekly Outlook: Higher Early, Then Lower? | 31 Aug–4 SepThe Fringe Cycles model read for the coming week suggests strength early in the week through Tuesday, followed by a shift to negative biases from Wednesday through Friday.
This outlook is based on the NQ Globex session, not just regular cash-session price action. Each daily bias applies approximately from 18:30 Eastern on the previous evening through 15:30 Eastern on the stated trading day.
For evaluation, each daily bias is measured from the 18:30 Eastern opening price using a 2% target, a 1%
Ethereum | Impulse or a Larger Correction?The daily ETH/USD structure is now at a critical decision point. Previous analyses suggested that the correction would gain greater credibility as complete only if the market subsequently revealed a clear impulsive character.
🟢 Bullish Case
From the bullish perspective, the current structure could mark the completion of a Running Flat, with the market now at the beginning of a new directional move.
However, price growth alone is not enough to confirm this idea. The upward move should develop
RKFORGE - Cash Pick - Stage 2 just getting startedTF: Weekly
Cmp: 750
I wish I picked this at 650 rs itself, but even now it is not late, despite after the 20% gains.
Stock is in the Stage 2 advancing phase, and dips are buyable. You can see what has happened in the previous Stage and also marked Stage 3, 4 and 1 for easy inference.
Only if you are comfortable holding it for months, you can buy this script.
Disclaimer: I am not a SEBI registered Analyst and this is not a trading advise. Views are personal and for educational purpose only
Ethereum: Bullish Impulse or Larger Correction?The weekly ETH/USD structure suggests that Ethereum is approaching a critical decision point within a larger-degree structure — where the completion of the correction and the beginning of a new impulsive cycle remain in competition with the possibility of further corrective or bearish development.
🟢 Bullish Case
In the bullish scenario, the larger structure may indicate that the higher-degree correction has completed as a Regular Flat.
If so, the next move should gradually reveal the characte
BTC SHORT - Looks like Lower High is in. H4 structure looks like lower high is in.
It didn't sweep the Buyside liquidity, which is something I wanted it to do.
Am I gonna short it? NO
Why? My A+ Setup's first criteria is Liq sweep.
Without Liq Sweep, No trade.
Could be search and destroy profile for the next 2 weeks, where it takes out both shorts and long and then the structure breaks.
This is the area where you should see lower high forming.
Bitcoin Crossroads Bitcoin Crossroads ⚡
Hello everyone, here is my latest Bitcoin Weekly Update, using my new analytical style.
After reviewing the larger-degree structure, Bitcoin appears to be at a point where two important paths are still on the table. At this stage, the structure needs more development before we can confidently favor one scenario over the other.
In the Aggressive Path — the Turquoise Scenario, the larger decline may have completed a corrective structure, with the current advance potentially
Crude Oil: When Market Structure Reveals The Next MoveIn this update, we take a closer look at the current Crude Oil structure on the 1-hour timeframe.
The purpose of this analysis is not to predict the market with certainty, but to study price behavior and understand the structure that the market is currently developing.
After completing a larger corrective structure, Crude Oil was able to create a bullish move that, from a wave personality perspective, showed signs of an impulsive structure.
Now, price has reached a critical point where we nee
Crude Oil: How Market Structure Reveals the Next MoveCrude Oil: Following Structure, Not Predictions
In this chart, we revisit a previous Crude Oil analysis that was published before the beginning of the recent bullish move and even before the latest geopolitical developments.
The purpose of this analysis was never to predict a specific event or guess the future. The goal was to study price behavior and understand the structure that the market was developing.
At that time, after completing a larger corrective structure, the market began showing
Crude Oil: Beyond Market Direction, Understanding Market StructuHello everyone,
In this update, we take another look at the Crude Oil chart.
We have slightly changed the way we present our analysis. The goal is not simply to say whether the market is bullish or bearish, but to understand the structure that the market is currently developing.
From the bullish perspective, or the aggressive scenario, after completing a large corrective cycle that included a complex Wave II structure, the market was able to create an impulsive move. At the moment, there is a
CRM — Weekly Structure | 200WMA Reclaim and Wave 1 in ProgressThesis
CRM appears to have completed its corrective ABC structure and has now broken back above the 200-week MA following a strong earnings reaction.
If this reclaim holds, I see the current move as the early stage of Wave 1, with the first major structural target around $333.
Context
- Weekly timeframe
- ABC correction appears complete
- I started building CRM in the mid $160s in May during the broader SaaS selloff
- The stock had moved deeply below its 200-week MA despite fundamentals tha
Bitcoin Momentum Update #7: Above the Upper ZoneBitcoin Daily Time Series Momentum has continued to strengthen and is currently around 1.21 , remaining above the upper reference level of 1.2 .
This marks a significant change from the previous update, when momentum was around 1.11 and accelerating toward the upper zone.
What has changed?
Momentum has now moved from simply being positive to an unusually strong daily momentum environment .
After breaking above 1.2, the indicator reached approximately 1.25 before easing slightly. Despite
NZDUSD Retracement started ??After a big rally price has finally reached a strong resistance level of 0.5988 intact since Feb 2026, many upswings had faced rejections from this level.
price has already started to consolidate in a sideways direction after retesting this zone and had broken below the immediate support of 0.5949, which signals bullishness exhausting and bears taking control.
Over all structure is aligns with the upcoming decline as we had seen in the past multiple times each time price had given breakout abo
CADJPY:Wave WhispersWave Whispers
On the three-month chart of CAD/JPY, the larger structure begins with a downward Zigzag, followed by a complex and somewhat irregular structure that may belong to the Double/Triple Zigzag or Combination family. At this stage, identifying the exact pattern is less important than understanding its degree and structural progression.
A sustained bullish move and a confirmed break above the previous peak could provide an important green light for the bullish scenario, initially openin
SPCX: A Post-IPO Base, Read HonestlyA young chart is the hardest place to be honest about a tool. SPCX has a few months of trading history - which means every layer reading it has had a few months to learn it, not years. We publish the read anyway, and we say that limitation out loud, because a tool that only speaks where it looks good is not a tool.
What the structure layer marked. After the post-IPO run to the low 220s, price spent June and July giving most of it back, and built a base through the summer around 107-118. Acro
$SOL - next leg up to $1,000+ is now startingSolana is showing similar fractal to 2023.
Solana is the most used blockchain, the fastest blockchain, the cheapest blockchain. Currently Solana is reaching all-time high metrics and leading every blockchain in active users, # transaction count, transactions per second (tps), apps built on top of it producing the most revenue, most tokenized stocks being built on top of solana, highest payment stablecoin transfer volume... the list goes on. price catches up to fundamentals soon.
CRYPTOCAP:SO
Bitcoin fever is just beginning. You are not ready for growthOver the past week, Bitcoin has grown by +20%!
Many cryptocurrencies from the top 100 also showed an increase of +20+100%.
In the last post in my channel, i wrote that there are ~52 days left for BTC to fall, after which the inevitable growth will begin.
But BTC does not have to fall for 50 days; after all, it has already shown a decline of -53% from the previous high. Such a correction is sufficient to start a new bullish cycle for the next 3 years.
Technically, BTC now broke the downtrend,
ALB: A Zone, a Reclaim, and Low Volume - Reading It HonestlyALB printed an accumulation zone 27 bars ago, near the low of a decline that had cut the stock roughly in half from its spring high. Price briefly traded under the reference, then reclaimed it and has moved well above it since. The panel today reads NO ACCUMULATION, last signal 27 bars ago, relative volume LOW. Reading those three things together - the zone, the reclaim, the volume - is today's lesson.
What the chart shows
Two zones in about sixteen months. The first, spring 2025, printed in
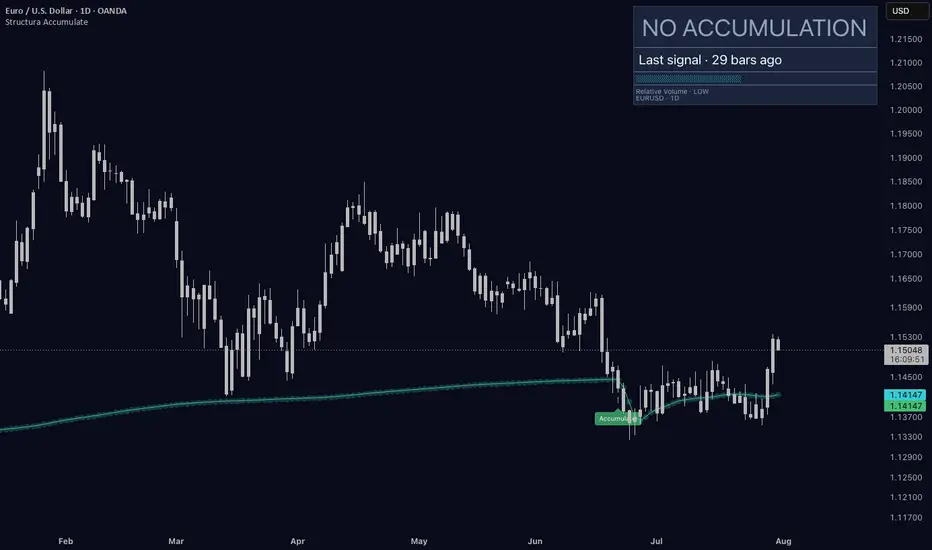
EURUSD: An Accumulation Zone Five Weeks InTwenty-nine bars ago, Structura Accumulate marked a zone on EURUSD's daily chart - the first in a long stretch of silence. Price has since built a base around the zone and, this week, pushed back above the adaptive reference at 1.1415. This is what a live test looks like, about halfway through - and reading it honestly matters more than cheering it.
What the chart shows
From the January high near 1.21, EURUSD declined for five months, breaking below the reference in late June. That break is
DOGE JUST HIT A HISTORICAL EXTREME.13 years of data.
RSI is at an all time low.
DOGE is sitting on its long term cycle floor.
And against NVIDIA, relative valuation is back near the same type of extreme zone that preceded previous major DOGE expansions.
The market sees weakness.
I see one of the most asymmetric DOGE setups in its history.
Fear is obvious. Opportunity is not.