ETHUSDT - Ready for Continued GrowthBINANCE:ETHUSDT is consolidating above 1898 following a distribution phase. From a technical perspective, the daily structure remains constructive, with ETH showing relative strength compared to Bitcoin, which increases the probability of further upside
Bitcoin is gradually recovering and approaching the key 65,150 trigger level. A breakout above this zone could provide additional support for the broader crypto market.
Against this backdrop, Ethereum has broken out of its local bearish corrective structure and entered a new bullish phase. Buyers are actively defending the 1898.5 support zone, keeping the door open for a continuation toward the 1936–1967 resistance area. At the moment, ETH continues to outperform Bitcoin
Resistance levels: 1936, 1967
Support levels: 1898, 1885
A retest of the nearest support zone remains possible. A long squeeze (liquidity sweep) around this area could become the technical catalyst for another bullish impulse toward the stated upside targets
Best regards,
R. Linda  Long
Long
Basic Chemical : Triple Confluence for Upside !TADAWUL:1210
📈 Descending Channel Meets Triple Confluence — Is a Bullish Reversal Brewing? 🇸🇦
The stock continues to trade within a well-defined descending parallel channel, but several technical signals suggest that selling pressure may be fading and a reversal could be taking shape.
With multiple bullish confluences aligning, this is a setup worth keeping on your watchlist.
🔍 Why This Setup Stands Out
📌 1. Descending Parallel Channel
Price remains confined within a descending channel, with the upper boundary acting as the first upside objective if buyers regain control.
A move toward the channel top would offer an attractive swing trading opportunity.
📌 2. Bullish Divergence at 22
The stock has formed a bullish divergence around the 22 level, indicating that bearish momentum is weakening despite price remaining near recent lows.
Historically, this type of divergence often precedes trend reversals when confirmed by price action.
📌 3. Fibonacci Discount Zone
The 22 support area also aligns closely with the 0.786 Fibonacci retracement, creating a high-conviction demand zone where institutional buying interest often emerges.
The combination of bullish divergence + 0.786 Fibonacci + channel support strengthens the technical significance of this area.
👀 One Missing Piece: A Higher Low (HL)
Despite the improving setup, one important confirmation is still missing—the formation of a Higher Low (HL).
A healthy pullback that establishes an HL would:
✅ Confirm the shift in market structure.
✅ Allow momentum indicators (such as RSI) to cool off naturally.
✅ Increase the probability of a sustainable rally instead of a short-lived bounce.
This would provide a much stronger entry than chasing the initial rebound.
🎯 Buy-the-Dip Strategy
If the stock forms a Higher Low, any controlled pullback could present a buy-on-dip opportunity with an initial target at the upper boundary of the descending channel.
Short-Term Targets:
🎯 26.80
🎯 27.62
🚀 Medium-to-Long-Term Outlook
A confirmed breakout above the channel would shift the focus toward larger Fibonacci retracement targets:
📈 Target 1: 38
📈 Target 2: 48
🚀 Extended Target: 63
These levels represent the next major resistance zones and would only become relevant if the stock confirms a complete trend reversal.
📊 My View
The chart is approaching a high-probability reversal setup, but patience remains essential.
✅ Bullish divergence around 22.
✅ 0.786 Fibonacci demand zone providing support.
✅ Descending channel nearing a potential breakout.
⏳ Still waiting for a Higher Low (HL) to confirm the trend reversal.
The best opportunities often come after confirmation—not anticipation. A Higher Low could be the final piece that turns this into a high-conviction bullish setup.
Do you think the bulls will defend the 22 demand zone and break out of the channel, or will the downtrend continue? Share your technical view below! 👇
#Tadawul #SaudiStockMarket #SaudiStocks #TASI #SaudiInvesting #SaudiTrading #SaudiInvestors #KSAStocks #SaudiEquities #MiddleEastMarkets #GCCMarkets
#TechnicalAnalysis #TradingView #PriceAction #DescendingChannel #BullishDivergence #Fibonacci #FibonacciRetracement #HigherLow #MarketStructure #SupportAndResistance #SwingTrading #TrendFollowing #BreakoutTrading #MomentumTrading #ChartAnalysis #TradingIdeas #StockAnalysis #BullishSetup #RiskManagement #Investing
#WiSHFundManagement  Long
Long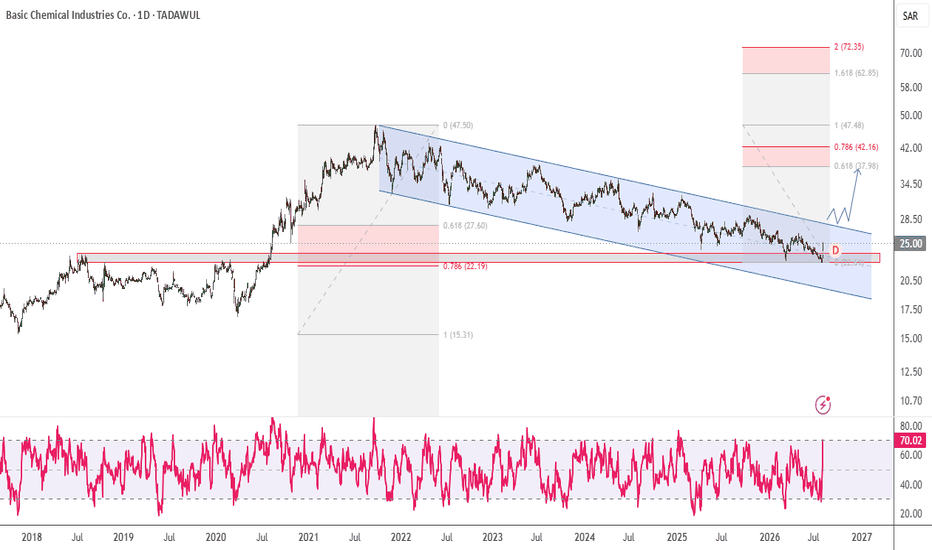
 Long
Long
GOLD - A short squeeze could lead to a correction ICMARKETS:XAUUSD is advancing during the Asian session as part of a distribution phase, testing the 4166–4195 resistance zone. The move is being driven by Western comments regarding negotiations in the Middle East. However, Iran has yet to respond, leaving geopolitical uncertainty elevated.
The U.S. dollar remains in consolidation following last week's decline, which was largely triggered by intervention in the Japanese yen. Gold showed little reaction to the weaker dollar and continued trading sideways. Today's rally is primarily geopolitically driven, but the backdrop remains fragile because the market has only heard one side of the story. Any unexpected development could quickly reverse the move.
At the same time, the Federal Reserve's hawkish stance and uncertainty surrounding the negotiations may continue to limit upside potential. The sustainability of the current recovery will depend on developments in the Strait of Hormuz and upcoming U.S. labor market data.
Resistance levels: 4166, 4195
Support levels: 4130, 4116
From a technical perspective, gold has broken above 4166, but buyers have so far been unable to build on the breakout. A false breakout from this resistance zone could trigger a corrective move under the pressure of the broader bearish trend. The 4195 level also remains a key liquidity zone. A short squeeze into either resistance area could provide the catalyst for a decline toward 4130–4110.
Best regards,
R. Linda  Short
Short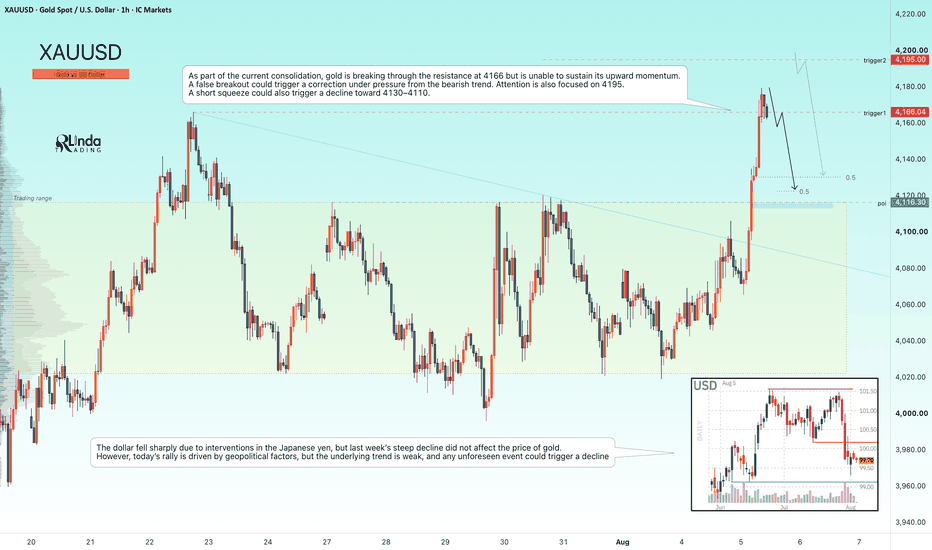
Gold H1: Liquidity Grab Before the Breakout?Gold remains trapped beneath a major descending institutional trendline after last week's sharp post-data volatility. While the US Dollar stays relatively firm following stronger-than-expected economic releases, traders are now shifting their attention to upcoming US ISM Services PMI and labor market data, which could determine whether Gold extends its recovery or revisits lower liquidity.
Despite the macro uncertainty, Smart Money structure on H1 continues to suggest that this decline may simply be a liquidity engineering phase rather than the start of a new bearish trend.
Technical Analysis (H1)
Price is currently trading inside a corrective phase beneath the Institutional Supply Trendline, while respecting a developing bullish dealing range.
The recent rally created a significant displacement leg, leaving behind an unmitigated Fair Value Gap around 4,020–4,025, which aligns with an internal mitigation area.
Instead of chasing price near resistance, institutional order flow often seeks to rebalance inefficiencies before continuation.
Key observations:
• Institutional Supply Trendline continues to cap upside.
• Internal FVG around 4,020–4,025 remains the preferred mitigation zone.
• Major Bullish Order Block sits near 3,995–4,005.
• HTF Liquidity Pool remains above 4,100–4,105.
Trading Plan
Bullish Scenario
If Gold sweeps liquidity into the H1 FVG before printing a bullish CHoCH on M15/H1, buyers may target:
TP1: 4,075
TP2: 4,100
TP3: 4,120
Bearish Scenario
If price closes decisively below 3,995, the bullish structure weakens and a deeper liquidity sweep becomes likely.
Question:
Would you buy the FVG pullback or wait for the deeper Order Block around 4,000? Long 
Long 
NZDUSD - Ready for growth within the trend Following a strong rally, FX:NZDUSD is now retesting the former resistance of its trading range, which has turned into support. This creates an opportunity for the bullish trend to continue.
The U.S. Dollar Index has broken its recent market structure, and continued dollar weakness could provide additional support for the pair
From a technical perspective, NZDUSD is performing a classic support retest within its countertrend recovery, while buyers are actively defending the 0.5863 level. Sustained consolidation above this trigger could become the catalyst for another bullish impulse
Resistance levels: 0.5908, 0.6000
Support levels: 0.5863, 0.5825
As long as price remains above 0.5863, the pair has the potential to extend its recovery, supported by the current weakness in the U.S. Dollar Index
Best regards,
R. Linda EURJPY - Long squeeze on support amid a bullish trend FX:EURJPY has fallen sharply following the Bank of Japan's intervention, triggering a long squeeze below key support. A recovery back into the trading range could provide the foundation for a bullish rebound
The market is currently stabilizing after the sharp decline, with price testing what was previously the daily range support, now acting as resistance.
A move back above the 180.80 level, followed by sustained consolidation, would confirm the recent breakdown as a false breakout and could trigger a bullish impulse
Resistance levels: 182.10, 183.56
Support levels: 180.80, 179.50
If buyers manage to reclaim and hold 180.80, the pair could regain upside momentum, opening the way for a recovery toward the next resistance levels
Best regards,
R. Linda AMZN – Repair Trigger Reclaimed, Add Watch Eligible | CSE OptionAmazon is currently one of the strongest live continuation cases inside my CSE Capital — Option Decision OS, also known as the Continuation Swing Engine.
The current CSE read is very clear: the underlying thesis is intact, the trend is bullish, and the tactical repair trigger has been reclaimed. This is an important shift, because AMZN is no longer in a “wait for repair” state. The stock has already moved above the key repair area and is now trading above the main CSE entry zones.
At the time of this CSE snapshot, the provider price is around 284.62. That places AMZN above the Gold Entry zone around 236, above the Silver Entry zone around 250, and above the Bronze Entry zone around 266. The next important CSE zone is around 289, with a higher Master Fib target area around 305.35.
Current CSE read:
Manual Action: Hold / Profit Review
Underlying Thesis: Thesis Intact
Tactical Status: Repair Trigger Reclaimed
Add Status: Add Watch Eligible
Option Position: Profit Review
Signal Confidence: 92/100
Trend: Bullish
Provider Price: 284.62
Next Zone: 289.00
Hard Thesis Invalidation: 184.00
Tactical Failure / Reclaim Trigger: 236.00
Entry Setup Invalidation: 236.00
Macro Fib Status: Tactical Repaired / Macro Alive
This is exactly why I am building the CSE Option Decision OS. A normal chart view might simply say “AMZN is bullish” or “AMZN is breaking out.” But for options, that is not enough. The CSE framework separates the underlying thesis, the tactical repair, the entry zones, the add status, the existing position, the portfolio impact and the risk gate.
That separation is critical.
AMZN has repaired the tactical structure by reclaiming the 236 area. That level now becomes an important reference point for the broader thesis. As long as price remains above that zone, the macro structure stays alive and the bullish continuation case remains supported.
The 250 Silver Entry zone was the active focus / stabilization area. The 266 Bronze Entry zone represented a stronger momentum breakout confirmation area. AMZN is now above all of these zones, which is bullish from a structure perspective, but it also changes the risk/reward profile.
That is why the CSE model currently does not say “blind add.” It says Add Watch Eligible, but also Hold / Profit Review and Reduce Review on the existing position layer. This is a very important distinction. When a stock moves strongly above the preferred entry zones, the opportunity may still be valid, but the option entry can become more expensive and less efficient.
In my case, AMZN is also an existing long-dated call position case. That means the decision is no longer only about finding a new entry. It is also about position management: protect the thesis, review profit, avoid unnecessary concentration and only consider additional exposure if the next setup truly passes the full decision process.
The current chart structure shows a strong move toward the next zone around 289. If AMZN can accept above that region, the next higher CSE target area around 305 becomes more relevant. But if price fails near the next zone and starts losing momentum, the correct decision may be to simply hold, review profit or reduce risk rather than chase.
This is the practical edge of the CSE Capital — Option Decision OS:
It does not only ask whether the stock is strong.
It asks whether the option decision is still intelligent.
For AMZN, the bullish continuation structure is clearly improving. The thesis is intact, the repair trigger has been reclaimed, trend is bullish and signal confidence is high. But the model still keeps the process disciplined: above entry zone means do not chase unless breakout is confirmed.
Every option idea still needs to pass the Option Feasibility + Risk Gate. That means checking premium size, liquidity, bid/ask spread, delta, expiry, time value, implied volatility, portfolio exposure, concentration risk and risk/reward before taking action.
My current interpretation:
AMZN remains one of the strongest CSE continuation cases.
The thesis is intact.
The tactical repair has been confirmed.
The stock is above the main entry zones.
The next validation area is around 289.
A higher continuation target sits around 305.
But because the stock is already extended above the preferred entry zones, the process shifts from entry hunting to profit review, add watch and risk management.
This is not prediction.
This is not hype.
This is not an automatic buy signal.
This is structured option decision support.
Structure first.
Confirmation second.
Option feasibility third.
No chase, no emotion, only process.
NVDA – Thesis Intact, 211 Reclaim Required | CSE Option DecisionNVIDIA remains one of the most important live momentum cases inside my CSE Capital — Option Decision OS, also known as the Continuation Swing Engine.
The current CSE read is very clear: the underlying thesis is still intact, the trend remains bullish, but the system does not classify this as a clean add setup yet. Instead, NVDA is currently in a Hold / Profit Review state with a reclaim watch around the 211 area.
At the time of this CSE snapshot, the provider price is around 207.91. That places NVDA above the Gold Entry reference around 202, but still below the Silver Entry / reclaim zone around 211. This is important because the model separates “support held” from “reclaim confirmed.” NVDA has repaired the deeper structure by staying above the 202 area, but the next tactical confirmation still requires a reclaim of the 211 zone.
Current CSE read:
Manual Action: Hold / Profit Review
Underlying Thesis: Thesis Intact
Tactical Status: Reclaim Required
Add Status: No Add
Option Position: Profit Review
Signal Confidence: 71/100
Trend: Bullish
Provider Price: 207.91
Next Zone: 211.14
Hard Thesis Invalidation: 161.00
Entry Setup Invalidation: 202.00
This is exactly why I am building the CSE Option Decision OS. A normal chart view might simply say “NVDA is bullish” or “NVDA is up.” But for options, that is not enough. The CSE model separates the underlying thesis, the tactical reclaim level, the option position, the add status, the entry zones, the risk gate and the portfolio decision.
That separation matters.
NVDA is still structurally bullish, but CSE does not give a blind add signal. The Gold Entry zone around 202 is marked as a support-hold area. That means it can be relevant only after confirmation. The Silver Entry zone around 211 is the current reclaim / stabilization area. The Bronze Entry zone around 223 represents a more aggressive breakout continuation zone, but the model specifically warns not to chase without strong trend confirmation.
In other words: NVDA remains strong, but the decision is not emotional.
The roadmap is also useful. The CSE structure currently highlights the 211 area as the next important zone, with a breakout reference around 215 and higher roadmap levels beyond that. If NVDA reclaims and holds above 211, the continuation structure improves. If it fails to reclaim that zone, the system keeps the position in Hold / Reclaim Watch rather than forcing a new entry.
For an options strategy, this is critical. NVIDIA options can move fast, but they can also become expensive very quickly. A strong stock does not automatically mean a good option entry. Every potential option idea still needs to pass the CSE Option Feasibility + Risk Gate.
That means checking premium size, liquidity, bid/ask spread, delta, expiry, time value, implied volatility, concentration risk, portfolio exposure and risk/reward before any decision can become actionable.
My current interpretation:
NVDA remains a core AI momentum leader.
The thesis is intact.
The trend is bullish.
The deeper support structure has repaired.
But the 211 reclaim is still the next tactical confirmation level.
CSE therefore keeps the position in Hold / Profit Review, not No-Brain Add.
This is not prediction.
This is not hype.
This is not an automatic buy signal.
This is structured option decision support.
Structure first.
Confirmation second.
Option feasibility third.
No chase, no emotion, only process.
 Short
Short
Thob Al-Aseel : Breakout for Upside RallyTADAWUL:4012
🚀 Trendline Breakout Loading? A Sustained Move Above 4 SAR Could Trigger Strong Upside 🇸🇦
The stock is showing encouraging signs of recovery after bouncing from a high-probability Fibonacci demand zone, and it's now approaching a critical trendline resistance that could define the next major move.
This is a setup where confirmation—not anticipation—can offer the best risk-to-reward opportunity.
🔍 Technical Outlook
The recent rebound originated from 3.11 SAR, which coincides with the 0.786 Fibonacci retracement of the 2.58 → 5.20 bullish swing.
This deep retracement level is widely regarded as an institutional accumulation zone, and the strong reaction suggests buyers are beginning to regain control.
📈 Breakout Level to Watch
The key trigger remains the descending trendline resistance.
A confirmed breakout, followed by a successful breakout–retest above 4.00 SAR, would provide strong technical confirmation that the downtrend has ended and a new bullish phase is underway.
✅ Bullish Confirmation Checklist
Trendline breakout
Sustained price above 4.00 SAR
Breakout–retest confirmation
Rising volume and bullish momentum
When these conditions align, the probability of a rapid upside expansion increases significantly.
🎯 My View
The rebound from 3.11 (0.786 Fibonacci retracement) has kept the bullish structure alive, but the market still needs to prove itself.
👀 Key Support: 3.11 SAR (0.786 Fibonacci demand zone)
🚀 Key Confirmation: Break and hold above 4.00 SAR
Rather than chasing price before confirmation, I'd prefer to wait for the breakout–retest to validate the trend reversal. Once confirmed, the stock could become an attractive momentum candidate for swing traders.
Will the bulls reclaim 4 SAR and trigger the next breakout, or will the trendline reject price once again? Share your technical view below! 👇
⚠️ Financial Disclaimer
Disclaimer: This analysis is shared for educational and informational purposes only and should not be considered financial, investment, or trading advice. Always conduct your own research (DYOR) and apply disciplined risk management before making investment decisions.
#Tadawul #SaudiStockMarket #SaudiStocks #TASI #SaudiInvesting #SaudiTrading #SaudiInvestors #KSAStocks #SaudiEquities #RiyadhMarket #GCCMarkets #MiddleEastMarkets
#TechnicalAnalysis #TradingView #PriceAction #TrendlineBreakout #BreakoutRetest #Fibonacci #FibonacciRetracement #BullishSetup #MarketStructure #SupportAndResistance #SwingTrading #MomentumTrading #TrendFollowing #ChartAnalysis #TradingIdeas #StockAnalysis #RiskManagement #Investing #BreakoutTrading #TechnicalTrader
#WiSHFundManagement  Long
Long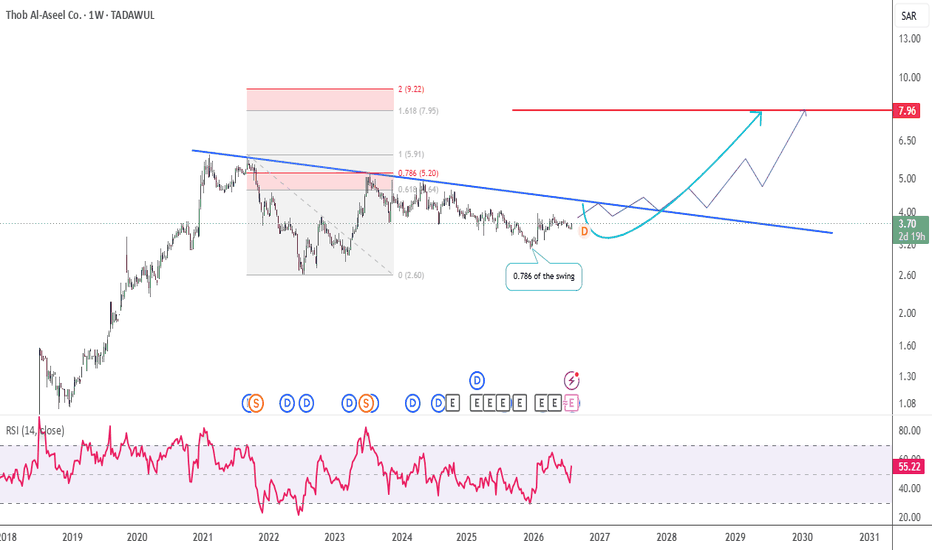
Fitaihi Holding Group : Triple Confluence in Play 🇸🇦TADAWUL:4180
🚀 Triple Confluence in Play: Is This the Next High-Probability Reversal Zone? 🇸🇦
The stock is approaching a high-confluence technical area, where multiple bullish signals are beginning to align.
While the broader trend still requires confirmation, the current setup deserves a place on every swing trader's watchlist.
🔍 Three Technical Confluences Supporting the Bullish Case
📌 1. Bull Flag Formation
Price continues to develop a Bull Flag, a classic continuation pattern that often appears before the next impulsive move.
A confirmed breakout from this structure could attract fresh buying momentum.
📌 2. Deep Fibonacci Discount Zone
The stock is trading within the 0.618–0.786 Fibonacci retracement zone—an area widely regarded as a high-probability institutional accumulation zone.
Historically, this range has often produced strong rebounds when supported by bullish price action.
📌 3. Weekly Reversal Zone at 2.60
The 2.60 price level has repeatedly acted as a major weekly reversal point, making it one of the most significant support zones on the chart.
The convergence of historical support, Fibonacci retracement, and the flag pattern strengthens the technical importance of this area.
📊 RSI: Momentum Confirmation Still Needed
Momentum is also beginning to improve.
The Relative Strength Index (RSI) is approaching the 50 level, which often marks the transition from bearish to bullish momentum.
👀 Key RSI Trigger:
✅ A sustained move above 50 would indicate improving buying strength.
🚀 A breakout into the 50–60 RSI zone would provide stronger confirmation that bulls are regaining control and that momentum is shifting in favor of an upside continuation.
📈 My View
This is one of those setups where confluence matters more than any single indicator.
✅ Bull Flag pattern developing.
✅ Trading inside the 0.618–0.786 Fibonacci discount zone.
✅ Strong weekly support at 2.60.
✅ RSI approaching a bullish momentum shift.
Rather than predicting the breakout, I'd prefer to wait for price confirmation and RSI strength before increasing exposure.
If buyers successfully defend this zone and momentum confirms, this setup could evolve into a high-probability swing trading opportunity.
Will this triple-confluence zone trigger the next bullish breakout, or will sellers defend the range once again? Share your technical outlook below! 👇
#Tadawul #SaudiStockMarket #SaudiStocks #TASI #SaudiInvesting #SaudiTrading #SaudiInvestors #KSAStocks #SaudiEquities #MiddleEastMarkets #GCCMarkets
#TechnicalAnalysis #TradingView #PriceAction #BullFlag #ChartPattern #Fibonacci #FibonacciRetracement #DemandZone #RSI #MarketStructure #SupportAndResistance #SwingTrading #BreakoutTrading #TrendFollowing #MomentumTrading #ChartAnalysis #TradingIdeas #StockAnalysis #BullishSetup #RiskManagement
#WiSHFundManagement  Long
Long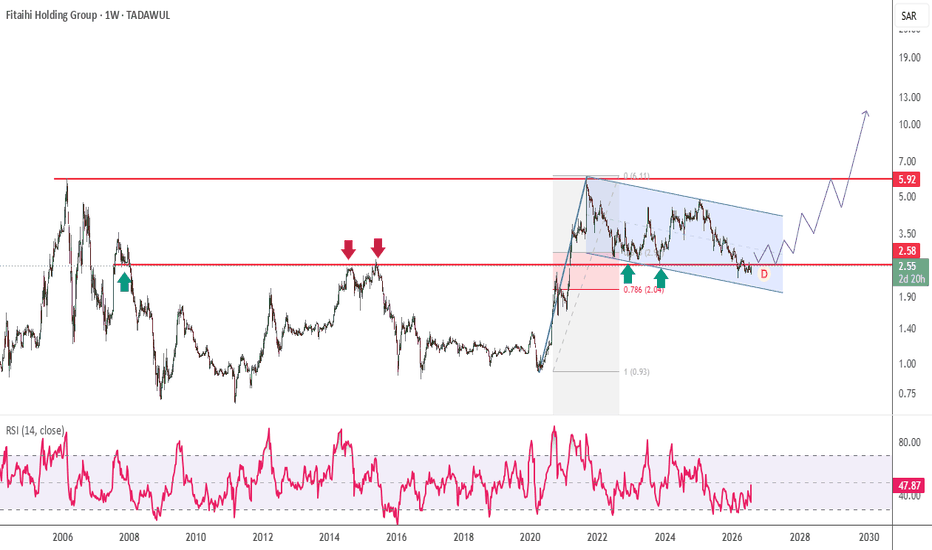
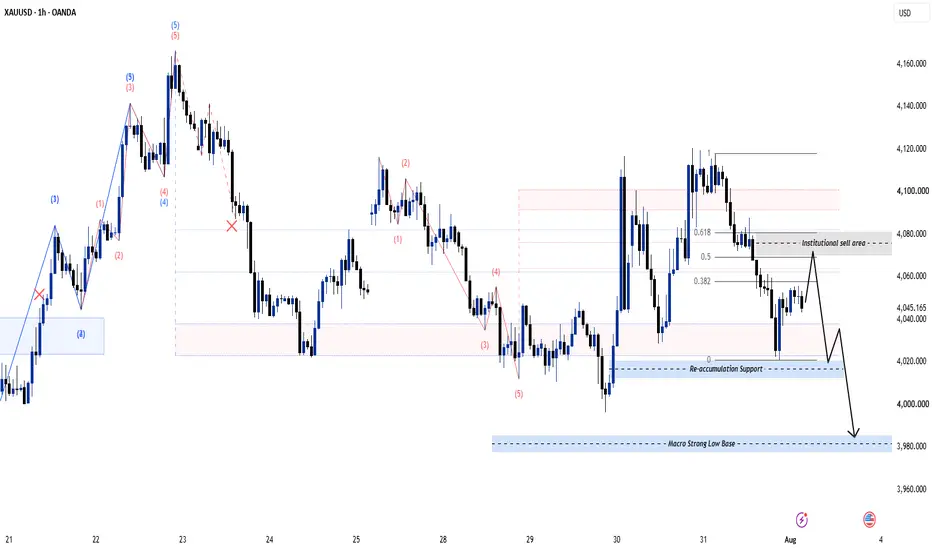
Gold H1: 4,020 Sweep Before Another Selloff?
📊 H1 Market Structure
After printing a strong impulsive rally, price has entered a corrective sequence.
The latest decline rejected the premium dealing range while respecting the 50%-61.8% retracement, suggesting institutions are distributing inventory rather than initiating fresh buying.
Current structure:
• Lower High developing beneath 4,110
• Bearish market structure remains intact
• Retracement into premium completed
• Discount liquidity remains untouched
As long as price trades below the recent swing high, sellers still control short-term order flow.
🎯 Key ICT Levels
Premium Distribution Zone
🔴 4,075 – 4,100
Institutional sell area
Reaction Zone
🟩 4,040 – 4,050
Current mitigation area
Re-Accumulation Support
🟦 4,015 – 4,020
First downside liquidity objective
Major Sell-Side Liquidity
🟦 3,980 – 3,985
Macro discount objective
Likely location for institutional accumulation if selling accelerates.
Many traders see this pullback as a buying opportunity.
I see something different.
Until Smart Money finishes collecting liquidity below 4,020, buying aggressively carries unnecessary risk.
The highest-probability opportunity may come after the sell-side liquidity is engineered—not before.
Do you think Gold has already bottomed, or is one final sweep toward 3,980 still coming? Short 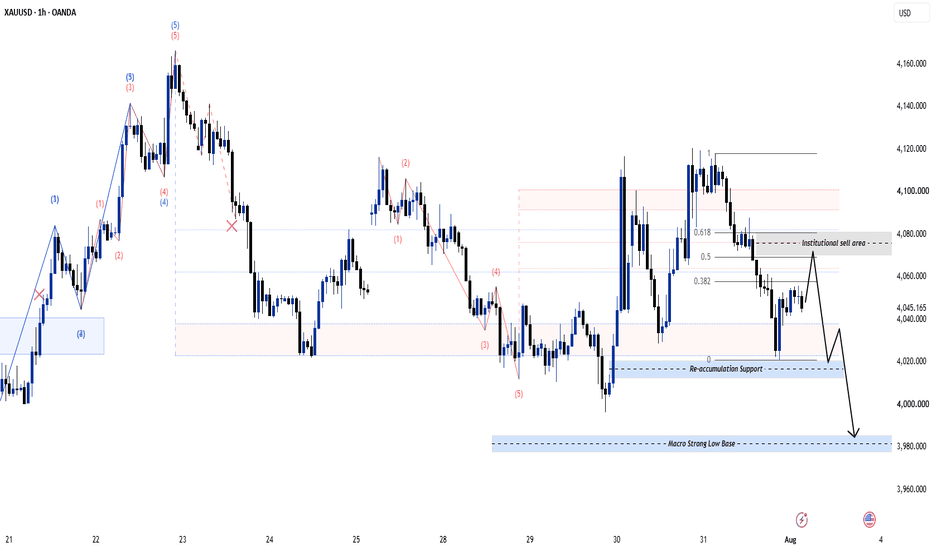
Fibonacci Retracement: Only Works Where the Chart Has StructureA Fibonacci retracement can be drawn between almost any two points on a chart, and it always produces the same tidy grid. That is the problem. The tool looks objective while the only objective input is where you decided to click. A Fibonacci level is not a forecast. It is a place where a lot of traders happen to be looking at once, and it becomes tradeable only when it lands on structure the chart already had.
The evidence supports that skepticism. Roy Batchelor and Richard Ramyar tested whether the ratios of successive price trends in the Dow Jones Industrial Average from 1914 to 2002 cluster around Fibonacci ratios. A few significant ratios appeared, but no more than chance would produce across that many tests. The ratios are not a hidden law of markets. What makes them useful is more ordinary: everyone can see them.
What Is Fibonacci Retracement?
Fibonacci retracement measures a completed price move and marks the percentages of it where a pullback might stall. You anchor the tool to one swing and the platform draws the levels. The percentages come from the Fibonacci sequence, where each number is the sum of the two before it: 1, 1, 2, 3, 5, 8, 13, 21, 34, 55. Divide any number by the one after it and the result converges on 0.618, the golden ratio. Two places along gives 0.382, three places gives 0.236, and 78.6 percent is the square root of 0.618. Applying these ratios to markets traces back to Ralph Nelson Elliott's 1946 monograph Nature's Law: The Secret of the Universe . One number on the tool is neither his nor Fibonacci's: 50 percent comes from Dow theory, and it sits there because traders watch it.
The Fibonacci Retracement Levels and What Each One Means
The standard Fibonacci retracement levels each describe a different depth of pullback:
23.6 percent: a shallow pause, typical of a fast trend.
38.2 percent: a normal correction, often the first level to produce a reaction.
50 percent: the psychological midpoint, not Fibonacci but heavily watched.
61.8 percent: the golden ratio, the level most traders anchor to.
78.6 percent: a deep retracement that puts the trend in question.
The tool divides one completed swing into levels. Each level describes a depth of pullback, not a prediction that price will stop there.
How to Draw Fibonacci Retracement Correctly
Direction is the most common mistake. In an uptrend, drag the tool from the swing low to the swing high, so the levels sit below the high and mark potential pullback support. In a downtrend, reverse it. Drawn backwards, every level lands where price has already been.
Use the extremes, including wicks. Anchoring to candle bodies shortens the range and shifts every level.
Pick swings a stranger would also pick. If you have to hunt for the anchor points, the swing is too small.
Redraw when structure changes. The levels belong to the swing, not the chart.
Left: the tool dragged in the wrong direction on an uptrend. Right: the correct anchoring, low to high, marking possible pullback support.
How to Use Fibonacci Retracement in a Trade
Knowing how to use Fibonacci retracement means treating a level as a place to start looking, not an entry signal. Price reaching 61.8 percent tells you nothing on its own. The level narrows the chart to an area where you can demand evidence.
Entry. Wait for a reaction at the level: a rejection wick, an engulfing candle, or a clear stall in momentum. Entering on the touch bets that the number is magic. Entering on the reaction responds to what buyers actually did.
Stop loss. Place the stop beyond the next level down. If price is reacting at 61.8 percent, the idea is not disproved until it closes through 78.6 percent. A stop in the noise between two levels gets taken out by ordinary volatility.
Take profit. The first target is the swing high that anchored the measurement. If your stop is as far away as your target, skip the trade.
The Fibonacci Golden Pocket
The Fibonacci golden pocket is the band between the 61.8 and 65 percent levels. It draws more attention than any other zone, for a circular reason. Carol Osler's study of a foreign exchange dealing bank's order book, published in the Journal of Finance in 2003, showed that take-profit orders cluster at specific prices and that this clustering produces the bounces. A level works when real orders rest on it. The golden pocket attracts orders because it is the most widely taught level, and those orders make it react.
Bitcoin's rally from the September 2024 low near 52,560 dollars to the January 2025 high around 109,350 dollars puts the 61.8 percent retracement at about 74,245 dollars, with the golden pocket running down to roughly 72,400. The March 2024 all-time high sat at 73,750 dollars, inside that band. Bitcoin then bottomed on 7 April 2025 near 74,637 dollars, half a percent above the 61.8 percent level and right on the old high. The ratio did not stop the market. It coincided with a structural level thousands of traders already watched, and together they concentrated enough buying to end the decline.
The April 2025 low formed where the golden pocket and the previous all-time high overlapped. The confluence did the work, not the ratio alone.
Fibonacci Retracement vs Extension
Fibonacci retracement vs extension comes down to whether you are measuring inside a move or beyond it.
Fibonacci retracement
Measures: a pullback inside a completed move
Levels sit: between the swing low and the swing high
Key ratios: 23.6, 38.2, 50, 61.8, 78.6 percent
Used for: finding an entry with the trend
Fibonacci extension
Measures: continuation past the end of the move
Levels sit: beyond the prior swing high or low
Key ratios: 127.2, 161.8, 261.8 percent
Used for: setting targets once the trend resumes
Use them in sequence: retracement for the entry, extension for the target.
When Fibonacci Works and When It Fails
The case for it. The most methodical test is a 2022 study in Expert Systems with Applications that used an algorithm to identify Fibonacci retracements across three equity markets. It found a positive relationship between the width of the Fibonacci zone and the probability of a bounce, while noting this does not by itself imply a profitable strategy.
The case against it. Batchelor and Ramyar's Dow study found no meaningful clustering at Fibonacci ratios once the number of tests was accounted for. The tool is also subjective where it matters most: two traders anchoring to different swings get different levels, and both can defend the choice.
Market regime is decisive. Retracement levels assume the trend is intact and the pullback temporary. On the next Bitcoin swing, April 2025 low to the October 2025 high around 126,198 dollars, the golden pocket sat between roughly 92,700 and 94,300 dollars. In November 2025 price cut straight through it to roughly 80,600 , past even the 78.6 percent level near 85,671. Nothing was wrong with the drawing. The market had stopped correcting and started reversing, and no ratio protects you from that.
Treat Fibonacci retracement as a filter, not a signal. Reducing a chart to five places worth watching is useful. Telling you price will turn at one of them is beyond the tool. The levels that matter sit on something the market already respected: a previous high, a broken support, a volume shelf. Find that overlap and wait for the reaction. The ratio is a reason to pay attention, not a reason to be in a trade.
 Education
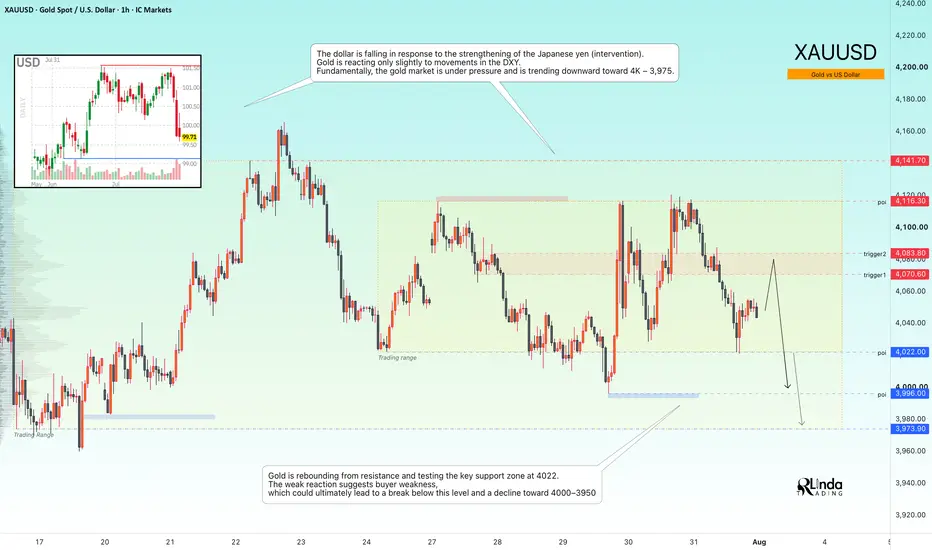
GOLD - Consolidation Amid a Bearish Trend ICMARKETS:XAUUSD remains trapped within the 4022–4116 trading range as markets await the next major economic catalysts. From a technical perspective, however, the broader bearish trend continues to dominate
The U.S. dollar has weakened following renewed strength in the Japanese yen, driven by intervention efforts. Despite this, gold has shown only a muted response to the decline in the DXY. Fundamentally, the metal remains under pressure, with the market still favoring a move toward the 4000–3975 area.
The fundamental backdrop remains challenging for gold. The Federal Reserve is facing an unusually deep policy divide, with three members favoring another rate hike, uncertainty surrounding Governor Waller's outlook, weaker U.S. macroeconomic data (GDP at 1.5%, PCE easing to 3.3%), and renewed geopolitical tensions in the Middle East. Higher oil prices continue to reinforce inflation concerns and support a more hawkish Fed outlook.
Technically, gold has rejected resistance and is now testing the key 4022 support level. The weak buying response suggests limited bullish momentum, increasing the probability of a downside breakout toward 4000–3950
Resistance levels: 4070, 4083, 4116
Support levels: 4022, 3996, 3973
Before the broader decline resumes, the market may first retest the 4070–4083 resistance zone from the session open. The 4116 level also remains a key area to watch. A short squeeze into these resistance levels could provide the catalyst for another bearish reversal toward 4000.
Best regards,
R. Linda Gold H1: Is $4,030 the Next Liquidity Sweep?Gold is trading around $4,074 after rejecting the $4,110–$4,120 supply zone. The H1 chart now shows a corrective pullback toward rising trendline support and the $4,060–$4,065 demand area.
Macro remains highly event-driven. The Fed held rates at 3.50%–3.75%, while June PCE showed inflation cooling but still elevated. That keeps USD/yields as key drivers for Gold volatility.
📊 H1 SMC Structure
BSL / Supply: $4,110–$4,120
Immediate POI: $4,060–$4,065
Primary Demand: $4,030–$4,035
Major Discount: $3,995–$4,005
Current price: ~$4,074
The key question is whether this is simply a liquidity retracement or the start of a deeper bearish displacement.
🔀 IF–THEN Scenarios
Bullish:
IF $4,060–$4,065 holds and M15/H1 prints bullish CHoCH →
THEN target $4,085 → $4,110 → $4,120.
Bearish:
IF price loses $4,060 and breaks the rising trendline →
THEN watch $4,030–$4,035, followed by $4,000.
My view: Don't chase the current move. Let Gold reach the POI and show confirmation.
Is $4,030 the real liquidity magnet? Short 
GOLD - The bearish trend continuesICMARKETS:XAUUSD remains in a medium-term bearish trend. The recent attempt to break above 4116 failed, and the market has once again transitioned into a selling phase
Gold is currently caught between geopolitical tensions, which tend to strengthen the U.S. dollar, and expectations surrounding upcoming central bank decisions. The next directional move will largely depend on developments in the Middle East and signals from the Bank of Japan. A continued hawkish stance from the Federal Reserve and a stronger dollar are likely to keep gold under pressure, while a weaker dollar and geopolitical de-escalation could support a recovery.
Bullish drivers: Geopolitical de-escalation, U.S. dollar weakness, A less aggressive Bank of Japan, Weaker-than-expected U.S. economic data
Bearish drivers: Escalation of geopolitical tensions (supporting the U.S. dollar), Renewed strength in oil prices, Strong U.S. macroeconomic data, Hawkish Federal Reserve rhetoric
Resistance levels: 4070, 4083, 4116
Support levels: 4028, 3995
The sharp decline in the U.S. dollar was largely a reaction to the Fed meeting and its mixed communication. However, the broader policy stance remains hawkish, supporting the longer-term bullish trend in the dollar and maintaining bearish pressure on gold.
Bears have successfully defended both 4116 and 4083, while price is now consolidating below 4083. Sustained trading beneath this level could provide the technical catalyst for another leg lower
Best regards,
R. Linda Short 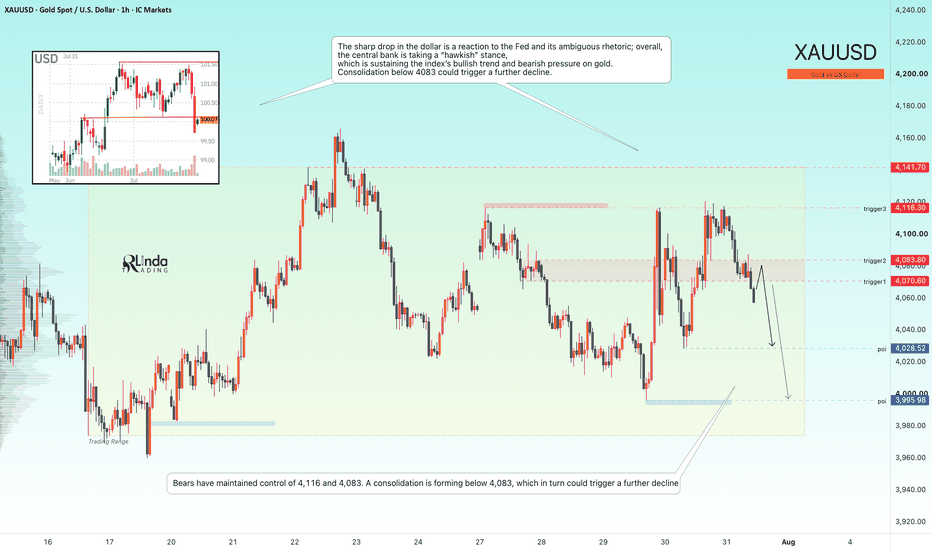
Watani Iron Steel (9513) : Confirmation Before the Next Move !!TADAWUL:9513
📈 Weekly Trendline Retest: Waiting for Confirmation Before the Next Move 🇸🇦
The stock has successfully retested its long-term weekly trendline, placing it at a critical technical decision point.
While the setup is becoming increasingly constructive, confirmation is still required before considering a high-conviction entry.
🔍 Technical Outlook
The current price action suggests that the market is attempting to convert the previous resistance into support.
However, rather than anticipating the move, I prefer to wait for a confirmed breakout–retest before building a position.
A successful confirmation would significantly strengthen the bullish case and improve the overall risk-to-reward profile.
📌 Daily 200 EMA: Key Dynamic Support
Another important technical level to monitor is the Daily 200 EMA, currently positioned around 1.97.
This area represents a strong confluence support zone and could become the foundation for the next bullish leg if buyers continue defending it.
👀 Medium-Term Watchlist Candidate
From a medium-term investment perspective, this stock deserves a place on the watchlist.
Rather than chasing price, I'd prefer to wait for:
✅ Confirmed breakout above resistance
✅ Successful retest of the breakout zone
✅ Price holding above the Daily 200 EMA
✅ Strong volume confirming institutional participation
These factors would provide greater confidence that the trend reversal is sustainable.
🎯 Fibonacci Profit-Taking Zones
If the breakout is confirmed and bullish momentum continues, the next technical objectives based on Fibonacci retracement/extension levels are:
🎯 Target 1: 2.80
🎯 Target 2: 3.20
🎯 Target 3: 3.96
These levels are likely to act as profit-taking and resistance zones, where traders should closely monitor price action.
📊 My View
The chart is approaching a high-probability technical setup, but patience remains the edge.
📈 Bullish Confirmation: Breakout followed by a successful retest above the weekly trendline.
🛡️ Key Support: Daily 200 EMA around 1.97.
🚀 Upside Potential: 2.80 → 3.20 → 3.96, provided the bullish market structure remains intact.
This is a stock worth watching—not chasing. Let the market confirm the breakout, then let the trend do the heavy lifting.
Do you think the weekly trendline retest will ignite the next rally, or is one more shakeout needed before the breakout? Share your analysis below! 👇
⚠️ Financial Disclaimer
Disclaimer: This analysis is shared for educational and informational purposes only and should not be considered financial, investment, or trading advice. Always conduct your own research (DYOR) and apply proper risk management before making any investment decisions.
#Tadawul #SaudiStockMarket #SaudiStocks #TASI #SaudiInvesting #SaudiTrading #SaudiInvestors #KSAStocks #SaudiEquities #RiyadhMarket #MiddleEastMarkets #GCCMarkets
#TechnicalAnalysis #TradingView #PriceAction #MarketStructure #WeeklyTrendline #BreakoutRetest #EMA200 #SupportAndResistance #Fibonacci #TrendFollowing #SwingTrading #BreakoutTrading #MomentumTrading #ChartAnalysis #TradingIdeas #StockAnalysis #RiskManagement #BullishSetup #Investing #StockMarket #WiSHFundManagement  Long
Long
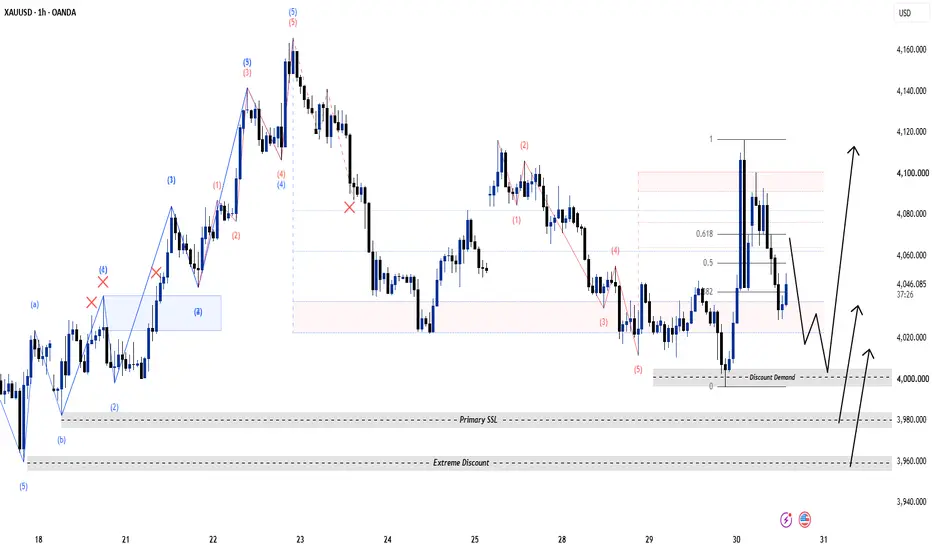
Gold H1: Is $4,000 the Next Liquidity Sweep?Gold is trading around $4,047, after the FOMC kept rates unchanged. The market is now shifting attention toward US Q2 GDP and June PCE, keeping volatility elevated. Gold initially reacted positively to the Fed decision, while the dollar eased, but the inflation data could still reshape rate expectations.
H1 Structure
The chart shows a clear bullish recovery from the $3,960–$3,980 discount area.
H1 impulsive leg remains constructive.
Price is currently retracing from the $4,100–$4,115 premium area.
Fibonacci retracement places the key reaction zones around:
0.382: ~$4,020
0.5: ~$4,040
0.618: ~$4,060
The $4,000 psychological level remains the major liquidity/demand zone.
Deeper demand sits around $3,960–$3,980.
Key Zones
Resistance / BSL
$4,075–$4,100
$4,115–$4,120
Retracement / Reaction
$4,040–$4,050
$4,020–$4,030
Major Demand
$4,000–$4,005
$3,960–$3,980
🧠 IF–THEN Playbook
IF Gold holds $4,020–$4,040 and prints bullish CHoCH/MSS on M15 →
THEN look for continuation toward $4,075 → $4,100 → $4,115.
IF price sweeps $4,000–$4,005 and quickly reclaims the level →
THEN the deeper liquidity grab could become the higher-quality long setup.
IF H1 closes decisively below $3,960 →
THEN the bullish recovery structure is invalidated.
Are we seeing a healthy H1 retracement — or the start of another $4,000 liquidity sweep? Long 
Mazagon Dock: Potential Reversal Candidate with Multi-Timeframe Mazagon Dock: Potential Reversal Candidate with Multi-Timeframe Bullish Setup
Mazagon Dock Shipbuilders Ltd. – Technical View
CMP: ₹2,523
Stop Loss: ₹2,310
Targets: ₹2,810 | ₹3,061 | 3326
Mazagon Dock is emerging as a potential reversal candidate, supported by bullish formations across multiple timeframes.
On the daily chart, the stock is forming a Flag & Pole continuation pattern. A decisive breakout above ₹2,569 could confirm the pattern and trigger fresh upside momentum.
On the weekly chart, the stock appears to be forming a Rounding Bottom pattern. A sustained breakout above ₹2,810 would confirm the larger reversal structure and may pave the way for the next leg of the uptrend toward ₹3,061.
Risk Management
Maintain strict stop-loss discipline.
Control position sizing.
Avoid overexposure in a volatile market.
Pyramiding can be considered only after a sustained move above key resistance levels with confirmation of trend continuation.
Consider partial profit booking near Target 1 and trail the stop loss thereafter.
⚠️ Be cautious in volatile markets. Maintain strict stop-loss discipline, control position sizing, avoid aggressive pyramiding, and do not overexpose capital.
⚠️ Clarification:
This is an independent analysis based purely on technical and market study. No part of Religare is involved in this view or recommendation.
📝 Important:
I am not responsible for any loss or profit incurred. I am not taking any fees for these views—just sharing my analysis for educational and informational purposes.
📉 Disclaimer:
Not SEBI-registered. Please do your own research or consult a financial advisor before taking any investment decision.  Long
Long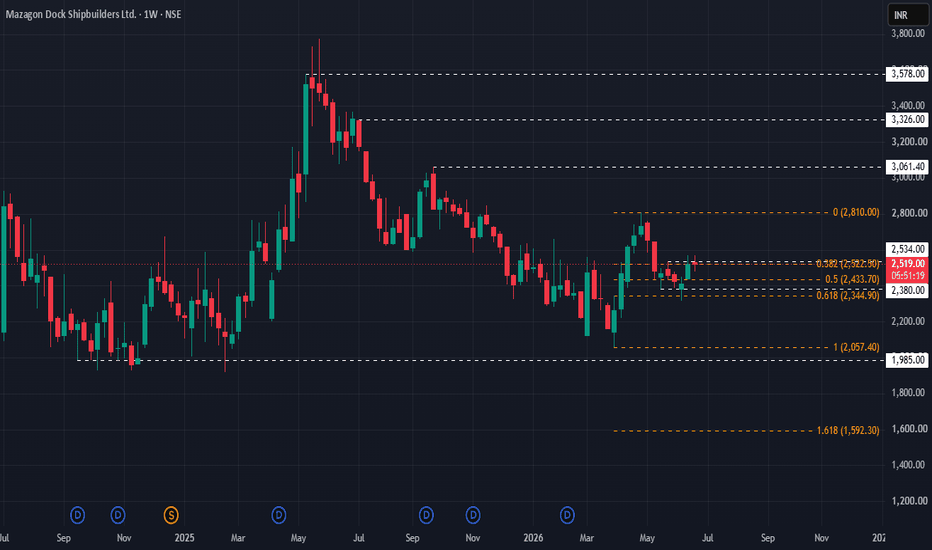
 Long
Long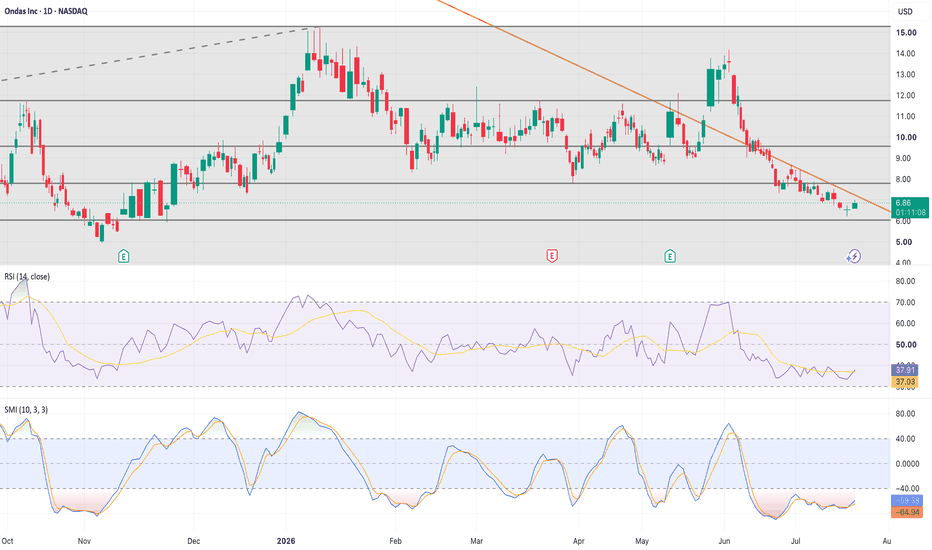
EURUSD | Buy-Side Liquidity Sweep Signals Bearish ContinuationEURUSD continues to present a bearish technical outlook following a buy-side liquidity sweep above the 1.14750 resistance level and the 2 July high, where price failed to sustain bullish momentum before rejecting lower. This liquidity grab suggests that buying pressure may have been exhausted, shifting the focus towards a potential continuation of the prevailing bearish structure. I will be monitoring a retracement into the highlighted retest zone, where multiple technical factors converge, including the 61.8%–88.6% Fibonacci retracement, previous market structure, and the potential alignment of the 200-period EMA as dynamic resistance. Should sellers defend this area, downside objectives remain the 13 July swing low, the current monthly low, and ultimately the previous month's support. However, a sustained 4-hour close above the liquidity sweep high would invalidate the current bearish thesis and suggest buyers have regained control.
From a fundamental perspective, this outlook is supported by the potential for continued US dollar strength should the Federal Reserve maintain a relatively restrictive monetary policy stance compared with the European Central Bank. A widening interest rate differential in favour of the United States, supported by elevated Treasury yields and resilient US economic data, could continue to underpin demand for the dollar, while softer Eurozone growth or inflation may reinforce expectations of a more accommodative ECB. Market participants should also remain attentive to upcoming high-impact releases, including US CPI, Non-Farm Payrolls, FOMC communications, and Eurozone inflation and ECB policy decisions, as these events may either reinforce or challenge the current macro narrative. While price action will ultimately determine whether this scenario develops, the technical and fundamental backdrop currently remain aligned in favour of further downside unless the stated invalidation level is reclaimed.