LITUSDT: Breakout Confirmed — Now We Wait for the PullbackLIT has broken above the descending pattern on the 4H timeframe after a strong move higher.
The important point now is not to chase the breakout.
Price may return toward the 4.55–4.75 support/pullback zone before continuing higher. A successful retest would give the bullish structure more confirmation.
Trade Setup
Timeframe: 4H
Pullback Zone: 4.55 – 4.75
Invalidation: 4.30
Pattern Target: 6.40
If the pullback holds and buyers defend the zone, the measured pattern target around 6.40 becomes the main technical objective.
A clean break below 4.30 would invalidate this setup.
A little about Litentry
Litentry is a Web3 infrastructure project focused on decentralized identity, privacy and cross-chain interoperability. Its IdentityHub is designed to aggregate and manage identity-related data across multiple blockchains, while using technologies such as TEE and verifiable credentials.
One important point for traders : Litentry has announced a transition toward Heima (HEI), with the project moving beyond its original identity focus toward broader chain-abstraction infrastructure. CoinMarketCap currently also flags the LIT → HEI migration.
For the chart, however, the key remains simple:
Wait for the pullback. Let price confirm the zone. Don't chase the breakout.
Risk Warning: This is technical analysis for educational purposes, not financial advice. Crypto assets are highly volatile. Always manage risk and trade according to your own plan.
Flag
MESU Sep 8: 7687 or 7725 — Which Liquidity Goes First?MESU is trading around 7,700 after overnight selling pressure, with liquidity sitting on both sides of the current price.
The first upside level I’m watching is around 7,725. A bounce could revisit this area before the market decides on its larger direction.
On the downside, the overnight low around 7,687 is the first liquidity target. If sellers push through that level with confirmation, the larger weekly support around 7,662 comes into focus.
The other major factor is the descending 4-hour trendline above price. As long as MESU remains below that resistance, my broader bias stays neutral. A confirmed breakout and acceptance above the trendline would make me more bullish.
Key levels
7,725 — upside liquidity
7,687 — overnight-low liquidity
7,662 — major weekly support
4H descending trendline — higher-time-frame resistance
Bullish scenario: Hold the downside structure and push toward 7,725. A confirmed trendline breakout could strengthen the bullish case.
Bearish scenario: Lose 7,687 → watch 7,662.
For now, price is between two liquidity pools, so I’m waiting for confirmation rather than forcing a directional bias.
Not financial advice. No confirmation, no trade. CME_MINI:MESU2026
Pole & Flag Setup on DEEDEVclassic Pole & Flag Setup on DEEDEV Development Engineers (DEEDEV)When a stock moves fast, it needs time to breathe. That is exactly what we are seeing here on the weekly chart of DEE Development Engineers Limited.
Key Technical Observations:
🎯 The Pole: A powerful, high-momentum vertical surge from the ₹180 levels up to ₹740.🏳️ The Flag: A orderly, downward-sloping consolidation channel where profit-taking is being absorbed by buyers.
⚡ The Breakout: The current price action is hovering right at the top edge of the channel resistance line, hinting at a potential continuation breakout
If the momentum sustains and breaks past the flag resistance, the measured move target could be significant.What's your take on this setup? Are you watching or skipping?Disclaimer: This post is purely for educational purposes and is not financial advice.
DASH Is Compressing — And Compression Precedes ExpansionIn markets as in nature, compression is rarely the end of a movement; it is merely the quiet gathering of energy before expansion.
When traders look at older payment networks like Dash, they often miss the underlying mechanics.
CRYPTOCAP:DASH Dash doesn't rely on hype-driven DeFi TVL metrics; its core strength lies in its dual-tier network.
With a substantial portion of the circulating supply locked inside Masternodes (acting as a natural supply sink), sell-side pressure dries up much faster during consolidation phases than in newer altcoins.
The Technical Structure:
Looking at the chart, Dash experienced a sharp impulsive move upward, followed by a textbook corrective pattern (a descending flag/wedge) .
This was not a distribution phase; it was a healthy digestion of gains.
Price has now broken out of the upper boundary of this corrective structure. However, chasing the initial breakout candle is an amateur mistake. We prefer to let the market show its hand and come back to test the newly reclaimed structure.
The Trade Plan:
We are observing price action for a potential retest into the Support Zone (around $39.5 - $40.5). A calm pullback into this zone will offer a much healthier risk-to-reward ratio.
Short-Term Target: $52.9 (100% Fibonacci projection / previous high)
Long-Term Target: $62.8 (161.8% Fibonacci extension)
Invalidation Level: $34.1
If price breaks below $34.1, the corrective pattern has failed, and the setup is invalidated immediately. Until then, we stay patient and let the structure play out.
Risk Warning:
This analysis is intended solely for educational purposes and does not constitute financial advice. Cryptocurrency trading involves extreme volatility and financial risk. Always manage your position size and trade with an active stop-loss.
Gold The Bull Flag Awaits ResolutionQuiet sessions test a trader's patience far more than volatile ones ever will.
Following yesterday’s structural shift where the Inverse Head & Shoulders pattern triggered our buy idea, Gold expanded nicely into a local high. Since the start of today's Asian and European sessions, however, price action has slowed to a crawl.
This sideways movement is not a sign of weakness; it is a textbook digestion phase forming a Bull Flag pattern on the H1 timeframe.
As we approach the end of the trading week, quiet morning sessions often act as liquidity traps. The market is winding up its spring, and the resolution of this flag structure will likely be dictated by the opening of the US session, where institutional volume enters the tape.
The Execution Strategy
Our overall bias remains Bullish as long as price respects the structural boundaries below.
We are looking for a clean upside breakout from the top trendline of this flag pattern to confirm the next leg higher.
Pattern Target: 4620.0
Invalidation Level: 4384.0
If price drops and closes below 4384 , the flag structure fails, the bullish continuation thesis is canceled, and we step aside immediately.
There is no need to force trades during Friday's mid-day lull. We let the US session bring the volume and let the breakout confirm our bias.
Risk Warning:
This analysis is provided strictly for educational purposes and does not constitute financial advice. Gold is highly volatile, especially during session opens and Friday market closes. Always apply strict risk controls.
Link above the double bottom neckline; Just had a golden cross. Link chart looking pretty bullish. Usually when the goldencross occurs with price action so high above the Moving averages like it did here the reaction is a dump but we can see how the thinner 20 day moving average is currently hoisting price action up and helping it to craw out of the bull flag its been consolidating in. We have been decently above link’s double bottom neckline for some time now too increasing the odds and probability that it is about to validate the double bottom breakout as well. As long as the 20ma holds support and continues pushing priceaction up out of the bull flag. The double bottom breakout should be validated and Link will likely have the $14.40 breakout target awaiting it in the near future. *not financial advice*
The game is a foot! 👀 SPOT THE DIFFERENCE?
🐂 Lots of bullish things going on here… BUT then the US Treasury Secretary, Scott Bessent, says… ❓🤔
🚶♂️💨 “Move along… nothing to see here!” 😴
Meanwhile… 🌱📈
🟢 The first serious green shoots we’ve seen in just about a YEAR! 🚀🔥
Bull trap… or is something finally changing? 👀
JUPUSD attempting to triangle bottom its way back into bull mode🐂 BULL CASE
🔺 Triangles often form around market bottoms
📈 Trend line has broken to the upside
🎯 Bearish targets have been met
🔪 But calling the exact bottom is like catching a falling knife
🚀 Crypto indexes are breaking out of long-term patterns to the upside
🐻 BEAR CASE
😴 Hibernation time again… 🥶
Possible another leg down, price back into the apex would be a nice place to add if you are going to play the bull side - Just watch out if this is wrong and the lower yellow trend line gets broken on volume. I suppose the governing factor will be if the bulls keep buying BTC and the total crypto ex BTC etc holds its little break out
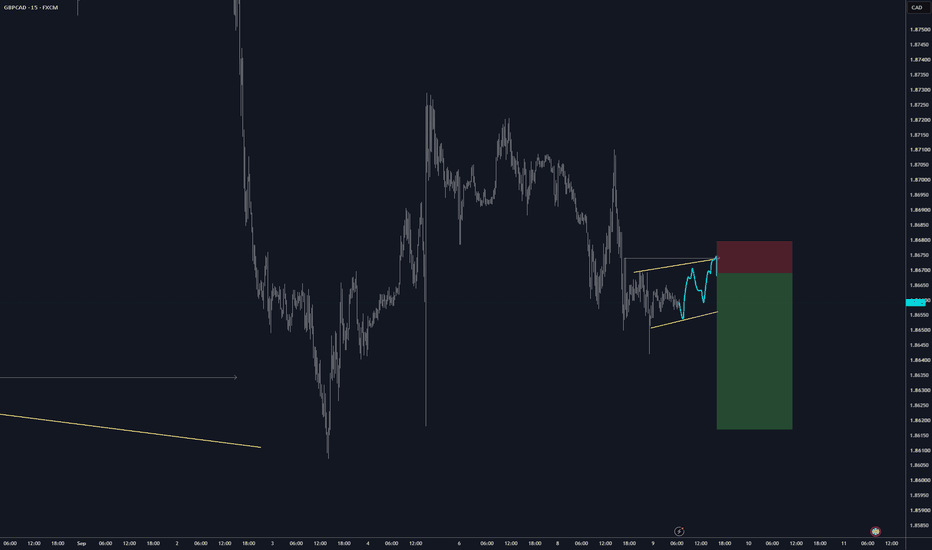
Price Action Education Series No. 010 - Bull FlagFlags are one of the cleanest continuation patterns in price action because they show a market taking a brief pause after a powerful move before continuing in the same direction. Think of them as a short reset inside a larger trend, not a full trend change. 🚩
A proper flag starts with a strong, nearly impulsive move called the flagpole. After that burst, price does not usually reverse the whole move. Instead, it drifts into a short consolidation that runs against the bigger trend and stays contained inside two roughly parallel lines. That is the key idea: flags are not random chop. They are organized pauses.
In a bull flag, price surges higher first, then pulls back in a tight downward-sloping or slightly sideways channel before breaking higher again. In a bear flag, price drops hard first, then bounces in a tight upward-sloping or sideways channel before breaking lower again. The correction should look controlled, not chaotic.
Why does this pattern matter? Because strong trends do not usually move in one straight line forever. Markets expand, pause, digest, and then often continue. A flag is that digestion phase. The first move creates urgency. The pause allows early traders to take profits, late traders to chase, and the market to work off short-term imbalance. If the underlying trend is still healthy, price often breaks out of the flag and resumes the original move. 🔥
✅ What defines a true flag?
• A strong flagpole before the pattern forms
• A brief countertrend pause
• Price action contained inside parallel lines
• A pattern that is relatively short-lived
• Breakout or breakdown in the direction of the original move
That “countertrend” detail is important. If the broader move is up, the flag usually slopes down. If the broader move is down, the flag usually slopes up. If the lines are not roughly parallel, you may be dealing with a wedge or some other structure instead.
📍The psychology behind flags:
The flagpole is the moment when one side takes clear control. Buyers overwhelm sellers in a bull move, or sellers overwhelm buyers in a bear move. After that, the market needs a breather. Some participants take profits, others fade the move, and new traders wait for a better entry. The result is a temporary pullback or drift against the original move. But if the opposing side cannot do more than create a short, contained pause, that weakness often tells you the dominant trend is still in charge.
That is why flags can be so powerful. The pause feels calm, but it is often just a staging area before continuation.
✅ Confirmation clues:
• The move into the pattern is sharp and obvious
• The flag channel is tight and orderly
• Volume often cools during the pause
• The break out of the flag happens back in the direction of trend
• Follow-through appears soon after the break
⚠️ Common mistakes:
• Calling every pullback a flag
• Ignoring the need for a clear flagpole
• Mistaking wedges or random chop for a flag
• Entering before the pattern is actually resolved
• Forgetting that the best flags are usually brief, not endless consolidations
🎯 Target concept:
One of the most useful parts of a flag is its projection logic. Many traders measure the height of the flagpole leading into the flag and project a similar distance from the breakout point. That is why flags are often described as “half-mast” patterns — the pause sits in the middle of a larger move.
🛠 Practical trading mindset:
Do not focus only on the little channel. Focus on the full sequence:
Strong impulse
Controlled pause
Continuation break
If the pause gets too sloppy, too deep, or too long, the setup loses quality. But when the structure is clean, flags can offer some of the clearest continuation entries in the market.
The real lesson is this: flags teach you that trends often need a short rest before the next push. Learn to recognize that pause correctly, and you stop confusing healthy consolidation with weakness. 📚📈
GOLD: The Trend Is No Longer HidingThe Trend Is No Longer Hiding
In my previous post regarding GOLD, I discussed how major trends are often born long before the crowd recognizes them.
At the time, Gold was trapped inside a large bearish flag, and the focus was on a potential structural shift rather than an immediate rally.
Today, that trend is no longer hiding.
✅ The bearish flag has been broken.
✅ Resistance has been reclaimed.
✅ The EMA20 has flipped from resistance into support.
✅ Higher highs and higher lows have emerged.
✅ Markup is underway.
📈 What Changed?
During the correction, sellers repeatedly defended the EMA20 and pushed price lower.
That behavior has now reversed.
Gold reclaimed the EMA20, held above it, and accelerated into a strong impulsive move. The correction phase gave way to a markup phase.
The market has already shown its hand.
🎯 What I'm watching now is a potential buying opportunity in the 4310-4430 zone:
🔹 EMA20 Confluence Support: 4430
🔹 EMA200 Confluence Support: 4310
After a strong rally, a corrective pullback is completely normal. In fact, healthy trends need periods of consolidation to sustain longer-term advances.
The key question is not whether Gold pulls back. The key question is where buyers step back in.
👀 My focus remains on the support zones marked above.
🚀 The Bigger Picture
Many traders spend their time searching for new trends. The bigger opportunity often comes from recognizing a trend early and staying with it as it matures.
The breakout happened.
The trend emerged. (identified timely)
Now it has room to grow.
Trade the trend until the trend gives you a reason not to.
USDJPY: Bullish Continuation 🇺🇸🇯🇵
A quick follow-up for yesterday's idea for USDJPY.
The price retested a recently broken daily structure resistance.
After its test, the price violated a resistance line of a bullish flag pattern on a 4H time frame.
We can expect that the market will continue rising and reach 160.19 level.
❤️Please, support my work with like, thank you!❤️
I am part of Trade Nation's Influencer program and receive a monthly fee for using their TradingView charts in my analysis.
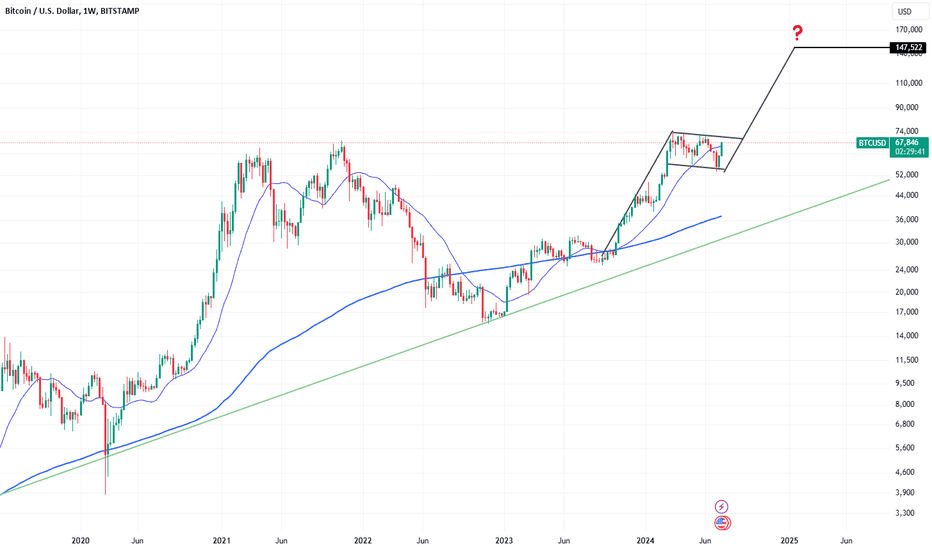
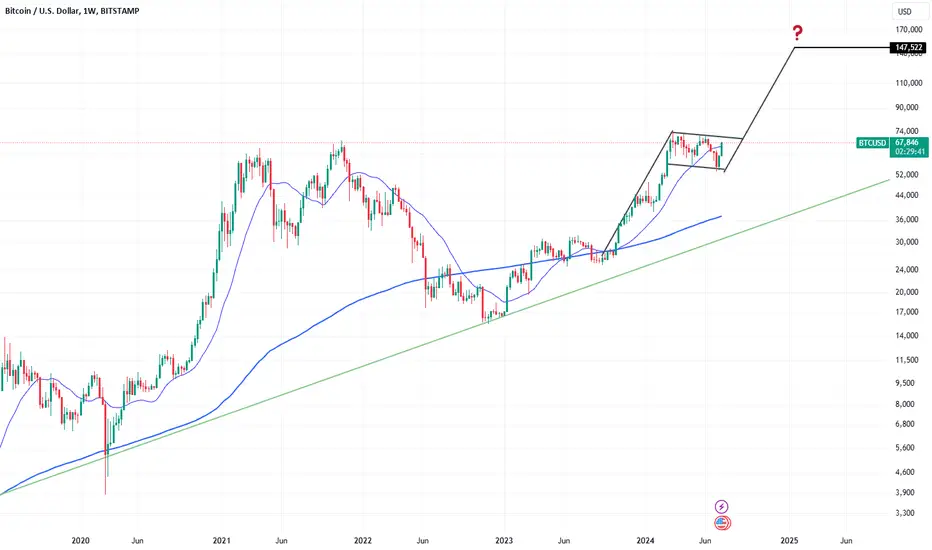
Bitcoin going for that moonlanding?Well, those who have followed our blogs over the last few years would know that we are somewhat (really) bullish on Bitcoin. yes sure, it will be a wildly bumpy ride, but if you have some, just keep em!
Anyway, this chart shows a potential breakout move to new highs. Wait for the flag formation to break higher before you have confirmation, but in our view this is a high probability outcome.
Gold Builds a Bullish Flag: Is $4,720 the Next Target?Gold ( OANDA:XAUUSD ) has continued its bullish trend after successfully breaking above the Descending Channel and the 200_SMA(Daily).
The price is now starting another bullish move from the Potential Reversal Zone(PRZ), while a Bullish Flag Pattern appears to be forming.
Can gold confirm another breakout and extend its rally toward the $4,720 area?
Technical Analysis
From an Elliott Wave perspective, gold appears to have completed Primary Wave 4, with its corrective structure developing as a Double Three Correction(WXY).
From a classical technical analysis perspective, gold also appears to be forming a Bullish Flag Pattern, supporting the possibility of bullish continuation.
💡 Educational Note: A Bullish Flag typically forms after a strong upward move and, if its upper trendline breaks, can signal continuation of the previous bullish trend.
I expect gold, after breaking the key $4,637 level, to break above the upper trendline of the Bullish Flag and rise at least toward $4,693.
If bullish momentum increases, the rally could extend toward the Potential Reversal Zone(PRZ).
Trade Setup
First Take Profit(TP): $4,693
Second Take Profit(TP): Potential Reversal Zone(PRZ)
Stop Loss(SL): $4,324
Key Trading Level: $4,637
Do you think gold can reach the Potential Reversal Zone(PRZ) before another correction?
🟢 Yes
🔴 No
📌 Gold Analysis(XAUUSD), 4-hour time frame
🛑 Always use proper risk management and set a Stop Loss(SL) for every position.
🚀 If this analysis helps your trading plan, a BOOST would help more traders discover it.
SOLANA - Add on Weakness and Chill toward 800+As you've heard me say before.... we see the bigger picture.
We don't let emotions or the tiny details get in the way of what is clearly laid out in front of us.
The final checks are being made.... oil is changed, air is in the tires, fluids are topped off.....ensuring that all cylinders are firing.
You see weakness from here on out... you know what to do.
The runway is there. It's validated. Don't even think. Just do.
See you all on the other-side soon gang.
-TradesTyrone