Nas100 overview. What a week.!!!Just a short explanation off what I’m expecting as I do have small notes on the chart. But for next week I’m mostly interested in seeing what spx500 is gonna do. I do expect that it may receive most of the injected volume next week as it is seriously behind ie. very much oversold. Buying from here would only be a benefit short term as prices are currently too high this early in the month to long.
For next week I’m bearish looking to take spx lower if opportunities develop. However with nas po
Fractal
A potential Bullish Butterfly on the HOTUSDT 2H chart
B: 0.789 retracement of XA ✅
C: 0.797 retracement of AB ✅
D: 1.62 extension of BC / 1.178 of XA → completing around 0.000251
The pattern is not complete yet — waiting for price to reach the D point (PRZ). 0.000197 remains a separate major support level to watch below.
No position should be considered until reversal confirmation (candle pattern, volume) appears at the PRZ.
Not financial advice.
#HOT #HOTUSDT #Butterfly #HarmonicPatterns #Binance
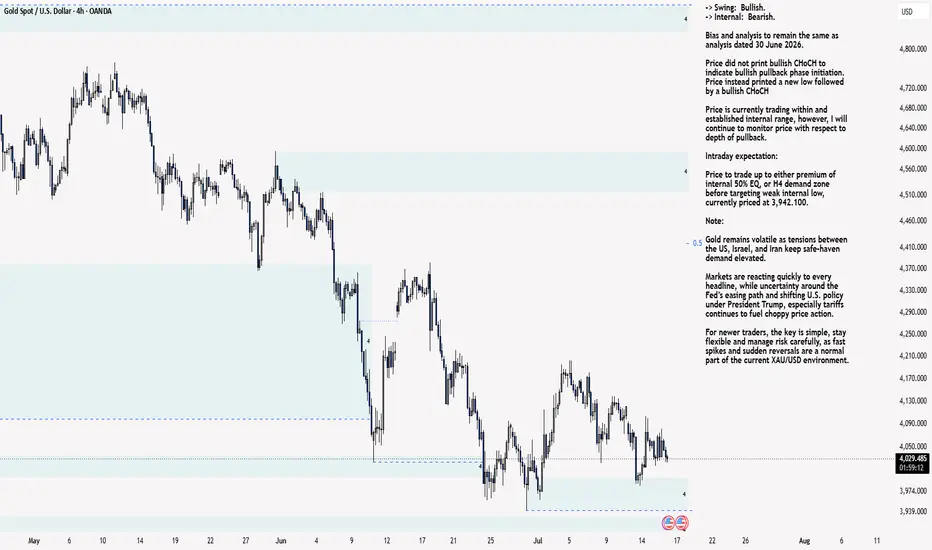
XAU/USD 17 July 2026 Intraday AnalysisH4 Analysis:
-> Swing: Bullish.
-> Internal: Bearish.
Bias and analysis to remain the same as analysis dated 30 June 2026.
Price did not print bullish CHoCH to indicate bullish pullback phase initiation. Price instead printed a new low followed by a bullish CHoCH
Price is currently trading within and established internal range, however, I will continue to monitor price with respect to depth of pullback.
Intraday expectation:
Price to trade up to either premium of internal 50% EQ, or
EURUSD Turtle Soup ReversalEURUSD has swept short-term sell-side liquidity and is now reacting from a precision breaker while respecting a nearby Fair Value Gap. If buyers continue to defend this area, the next objective is the cluster of buy-side liquidity resting overhead.
A classic Turtle Soup setup in the making.
Market Structure
• Sell-side liquidity has already been raided.
• Price is reacting from a precision breaker.
• A nearby FVG offers additional confluence.
• Buy-side liquidity remains the primary draw.
Bu
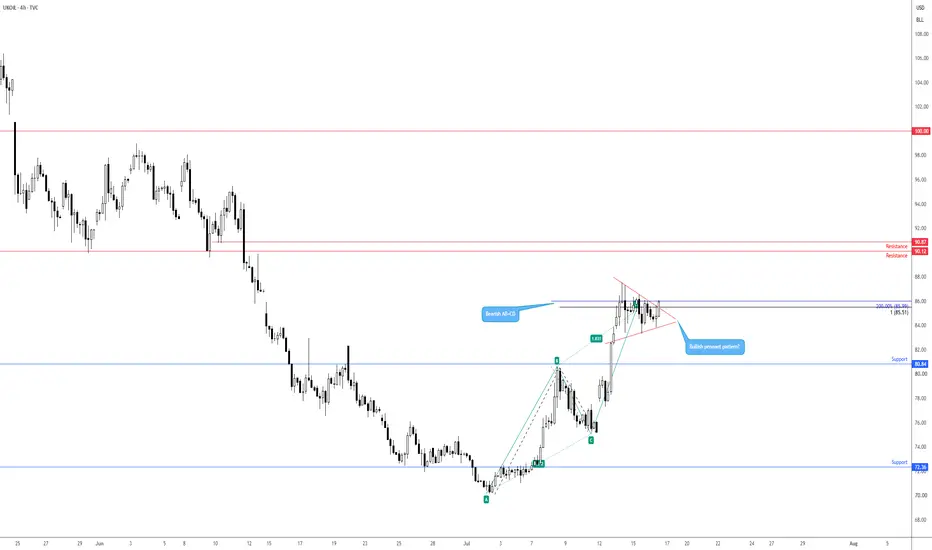
Brent crude about ready to burst?With Middle East flare-ups still front and centre and geopolitical risk premium being priced into oil, the technical picture on Brent crude right now shows a potential breakout brewing.
As shown in the chart, between US$87.55 and US$83.32, we have seen price build out a pennant pattern, with the unit not far from the formation’s apex and looking about ready to burst. Price is now on the verge of breaking out higher, perhaps clearing the path for a run towards a resistance zone between US$90.87
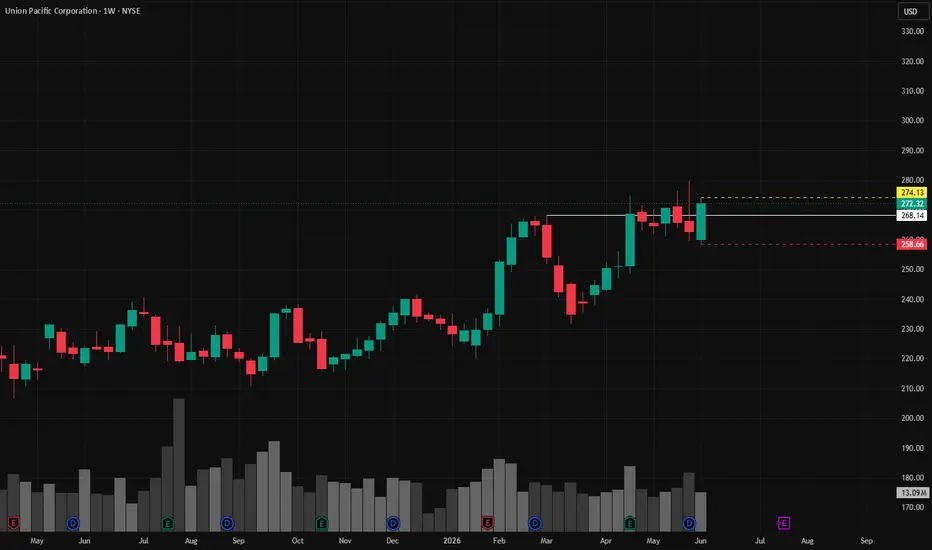
UNP | June, 2026 | Continued stock growth- Timeframe: Weekly
- Trade type: Buy stop order
- Price: 274.13
- Take Profit: Open
- Stop Loss: 258.66 (-5.60 %)
Idea: Long on a breakout above last week's high — bullish momentum continuation.
Entry: Buy stop above last week’s high.
Stop-loss: Below the low of the same candle.
If the weekly candle closes below this level, the trade is invalidated.
Take Profit: Trailing stop following the lows of new weekly candles.
Feel free to like and share your thoughts in the comments! ❤️
Bitcoin, Gold, and the Digital Gold CycleBitcoin, Gold, and the Digital Gold Cycle: Breakdown or Final Accumulation?
The idea of Bitcoin as "Digital Gold" has become increasingly popular over the past few years. However, this comparison often remains superficial. What matters more is how Bitcoin's behavior has gradually evolved to resemble gold across long term market cycles.
Looking at Bitcoin's monthly structure today, the market is once again testing the long term ascending support that has been in place since 2021. Interestingly,
XAU/USD 16 July 2026 Intraday AnalysisH4 Analysis:
-> Swing: Bullish.
-> Internal: Bearish.
Bias and analysis to remain the same as analysis dated 30 June 2026.
Price did not print bullish CHoCH to indicate bullish pullback phase initiation. Price instead printed a new low followed by a bullish CHoCH
Price is currently trading within and established internal range, however, I will continue to monitor price with respect to depth of pullback.
Intraday expectation:
Price to trade up to either premium of internal 50% EQ, or
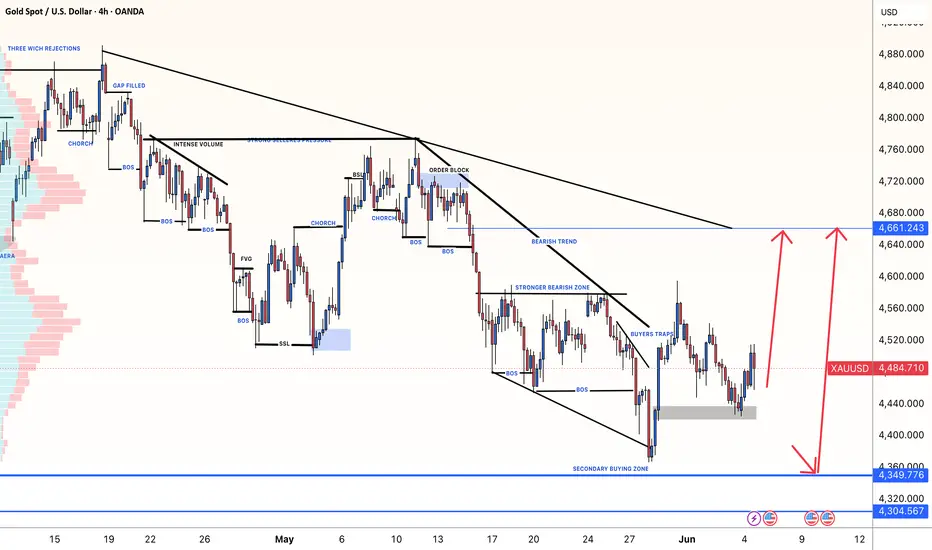
XAUUSD: Gold To Hit $4650 And Beyond! 04/06/2026Gold is poised to continue its upward trajectory towards our target zone at $4650 and potentially beyond. Currently, the price has formed an AB=CD pattern which is already confirmed and completed. This pattern suggests a sharp price breakthrough once it’s finished forming. Strong fundamental support is also needed to weaken the DXY. Good luck and trade safely.
Like and comment for more analysis.
The Setupsfx_ Team
XAUUSD ANALYSIS READ CAPTION Buying Entry: Around 4020–4024 (gray zone). The analysis suggests looking for a Buy from this support area.
Target Point (Take Profit): Around 4040. If the price goes up as expected, this is the profit target.
Trade Stop (Stop Loss): Around 4012. If the price falls below this level, the buy idea is considered invalid and the trade should be closed to limit losses.
Blue Arrow: It shows the expected movement: price may dip slightly into the buy zone, then rise toward the target.
Current price in t
XAU/USD 15 July 2026 Intraday AnalysisH4 Analysis:
-> Swing: Bullish.
-> Internal: Bearish.
Bias and analysis to remain the same as analysis dated 30 June 2026.
Price did not print bullish CHoCH to indicate bullish pullback phase initiation. Price instead printed a new low followed by a bullish CHoCH
Price is currently trading within and established internal range, however, I will continue to monitor price with respect to depth of pullback.
Intraday expectation:
Price to trade up to either premium of internal 50% EQ, or
XAU/USD 14 July 2026 Intraday AnalysisH4 Analysis:
-> Swing: Bullish.
-> Internal: Bearish.
Bias and analysis to remain the same as analysis dated 30 June 2026.
Price did not print bullish CHoCH to indicate bullish pullback phase initiation. Price instead printed a new low followed by a bullish CHoCH
Price is currently trading within and established internal range, however, I will continue to monitor price with respect to depth of pullback.
Intraday expectation:
Price to trade up to either premium of internal 50% EQ, or
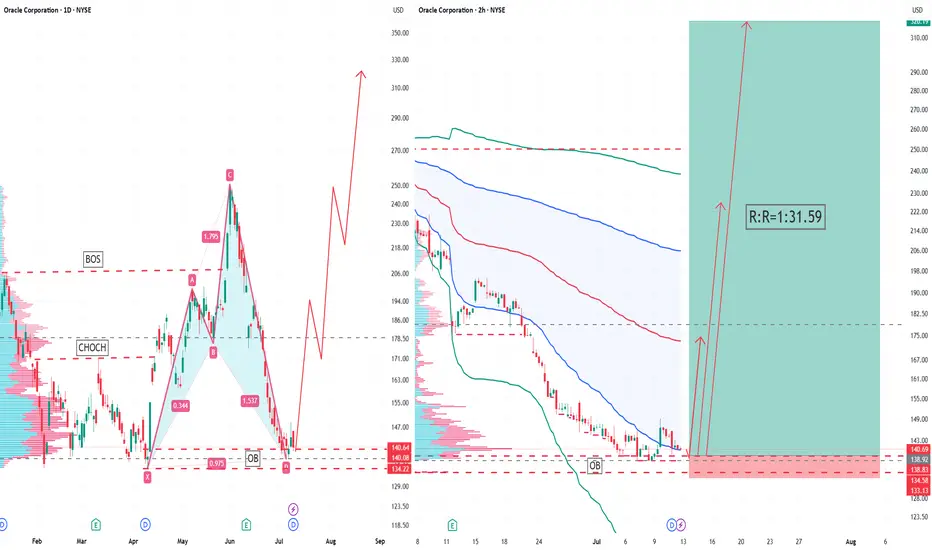
ORCL 2H Long Trading Plan (Final Professional Version)ORCL 2H Long Trading Plan (Final Professional Version)
Basic Information
• Trading Asset: ORCL (Oracle Corporation)
• Timeframe: 2-Hour Chart
• Trading Bias: Bullish Long
• Current Market Price: 140.69
Key Structural Zones
• Major Support Zone: 133.50 – 140.30
• Primary Resistance Zone: 190.00 – 200.00
• Secondary Resistance Zone: 230.00 – 250.00
• Tertiary Resistance Zone: 320.00 – 350.00
Entry & Hard Stop Loss Execution Rules
• Planned Long Entry Price: Around 139.00
• Fixed Hard
AUS200
Same logic. Applied across every instrument.
Price over everything.
Every headline, every rumor, every report, and every opinion is reflected in price.
This AUS200 setup is built on one thing only. Pure price action. No indicators. No noise.
The footprints are there for those who know where to look. Structure, liquidity, and market reaction tell the story long before the news does.
I trade what price reveals, not what people predict.
Price is the only language I need.
Price Left Clues👣
DAX : Buying the Pullback Instead of Chasing All-TimLast week, the DAX pushed into fresh all-time highs, and I warned against becoming the trader who buys at the most expensive price just before the market finally decides to pull back. Instead of chasing strength, the goal was to wait for price to give us some relief and look for an opportunity to enter at a more favorable level.
Thanks to the bearish Butterfly pattern, we were able to do exactly that — identifying a potential reversal zone and waiting for price to retrace into an area where buy
XAU/USD 13 July 2026 Intraday AnalysisH4 Analysis:
-> Swing: Bullish.
-> Internal: Bearish.
Bias and analysis to remain the same as analysis dated 30 June 2026.
Price did not print bullish CHoCH to indicate bullish pullback phase initiation. Price instead printed a new low followed by a bullish CHoCH
Price is currently trading within and established internal range, however, I will continue to monitor price with respect to depth of pullback.
Intraday expectation:
Price to trade up to either premium of internal 50% EQ, or
Daily Outlook || 13th July || CPI EveMarkets are sitting on a knife's edge heading into tomorrow's CPI print. Liquidity has been building on both sides of the market across forex, indices, gold, and Bitcoin — a setup that typically precedes a sharp directional resolution. Today's session is about mapping where that liquidity sits, not predicting which way it breaks.
In this video, we break down EURUSD, GBPUSD, XAUUSD (Gold), S&P 500, Nasdaq 100, and Bitcoin through the lens of:
Market Structure
Liquidity Mapping
Institutional Orde