SPX – Double Bounce Off 50 SMA, 7600 Call Wall Confluence SPX is showing a constructive daily structure after two recent rebounds off the 50 SMA — first in June, then again in July. Each dip found buyers at that moving average before price pushed back higher.
Price is now trading around 7554, well above the 7495 HVL, which keeps SPX inside a positive GEX regime. In this environment, moves tend to be more controlled than below HVL, and upside can extend as long as the structure holds.
The next major reference is 7600 — the highest call NETGEX wall and
Gamma
ETH GEX - Price Rejection at 1790 Call Wall AgainETH is showing a structurally important pullback after failing at the highest call NETGEX wall for the second time.
On the daily chart, price recently formed a double bottom near the 1590 zone — where the strongest put wall (P1) and HVL align — and rallied back into the upper transition area. That bounce held the downside structure, but the upside test at 1790 has now been rejected again, with today's red candle marking the second failure at the C1 call wall.
This matters because 1590 is not j
BTCUSD GEX – Hovering at C1 Call Wall After P1 BounceBitcoin has defended the 60000 put wall twice in recent weeks, reclaimed 60990 HVL, and is now pressing the 63550 C1 call wall. Spot sits slightly above C1 while 65651 (50 SMA) and the next call cluster around 65k cap the immediate upside.
🔶 Regime Context 🔶
Price is trading above HVL at 60990, keeping BTCUSD inside a positive GEX regime — typically more controlled than below the gamma flip. The recovery from 60000 P1 confirms that put-dominated support held; the open question is whether call-
/GC – Recovery Above HVL, 4315 Call Wall in FocusGold is showing early signs of stabilization on the daily chart after a sharp multi-month selloff. Price is now trading at 4175, holding above 4110 – HVL while the next major upside reference sits at 4315 – C1.
This matters because HVL acts as the regime pivot — above it, gold remains inside a positive GEX environment, where price action tends to become more controlled than in reactive downside conditions.
🔶 Regime Context 🔶
Gold is trading above HVL at 4110, keeping the market inside a posit
HOOD – Breakout Above C2, 110 Call Wall in FocusHOOD is showing strong momentum on the daily chart, rallying sharply from the 70 area in April and now pressing into the 110 call wall after clearing 105 – C2 .
Price has flipped C2 from resistance into support and is trading inside the positive gamma extension corridor between 105 and 110 , with the next structural test at the highest call NETGEX concentration on the board.
🔶 Regime Context 🔶
Price is trading well above HVL at 82 , keeping HOOD inside a positive GEX regime — pric
AAPL GEX - Testing 300 Call WallAAPL is consolidating on the daily chart after pulling back from the recent highs near 318 (nCOI zone), with price now sitting just below 300 — the highest call NETGEX wall on the board.
The stock remains structurally bullish on the daily timeframe, holding well above the 50 SMA and 200 SMA , but the immediate battle is whether momentum can reclaim and accept above the 300 multi-confluence cluster — or whether C1 continues to cap the bounce.
🔶 Regime Context 🔶
Price is trading well ab
MSFT GEX - Sitting right on Put WallMSFT is pressing into a familiar options level again.
On the daily chart, price is currently trading around 403 , sitting directly on top of 400 – P1 , the strongest put NETGEX wall. This is now the third time price has tested this zone in the current structure — and historically, 400 has acted as both support and resistance , not a one-direction level.
The immediate question is what happens right here , at the put wall.
🔶 Regime Context 🔶
Price is trading below HVL at 410 , keeping
Gamma Exposure Setup: SPY and VIX - 08 June 20261. AMEX:SPY is trading red in a negative gamma environment, while CBOE:VIX is trading green in a positive gamma regime, creating the expectation for a bearish 📉 move in CBOE:SPX
2. 🎯 Both reach important intraday boundaries:
* 🔴 AMEX:SPY touches its maximum 0DTE level.
* 🟢 CBOE:VIX touches its second-largest level and one of the day's lowest levels.
3. ⏱️ Both levels are hit simultaneously (blue vertical line), with SPY and VIX moving immediately in opposite directions ↔️.
COIN GEX - Bounce from multi-year lowsCOIN is showing a sharp daily rebound after testing the 150 – P1 put cluster, currently trading near 162.5 after a +6.6% session.
On the weekly chart , price is bouncing from a support zone in the 150–155 area that has now been touched four separate times in this cycle — a repeated reaction zone that strengthens the case for structural support here, even though no level guarantees a hold.
The bounce aligns with the strongest put GEX concentration on the profile, while the broader stru
GOOGL GEX - Bounce from Put WallGOOGL is showing a powerful bullish reversal on the daily chart. Price tested 360 – P1 , where the strongest put NETGEX wall aligns with nPV and PV — today’s heaviest put volume flow — in the same zone as an earlier gap-up fill and the 50 SMA at 360.90 . The result is a large green bullish candle that reclaimed 362.5 – HVL and closed above 370 – C1 at 371.95 .
The 370 strike is not a thin call line alone: it stacks C1 (highest call NETGEX), Ab1 (largest absolute gamma), and
Market Pulse After the CloseMarket Pulse - June 2, 2026 After-Close Map
Today was another “quiet headline, busy under the hood” session.
The S&P 500 and Dow closed modestly higher, Nasdaq finished nearly flat, and small caps outperformed. The bigger story was not broad index panic or euphoria. It was AI infrastructure strength, oil/geopolitical risk staying alive, and a hot JOLTS print that kept the labor market from looking weak.
Pre-market setup:
- Futures were slightly soft after Monday’s record-setting session.
- HP
AVGO GEX - Breakout Above C1AVGO is showing a strong daily momentum breakout, clearing 450 – C1 after weeks of consolidation inside a broadening wedge structure.
Price has now moved above C1 and is trading inside the positive gamma extension zone — the region between C1 and C2 where gamma squeeze potential opens toward the next major call wall if acceptance holds.
Price is holding well above both the 50 SMA and 200 SMA , with the moving averages in a bullish fan — momentum is aligned with the structural breako
NVDA – Pullback Holding Above P1/HVLNVDA is pulling back after a sharp rally that peaked near 236 in late May.
On the daily chart, price has retraced from those highs but remains above P1 and the High Volatility Level around 207.5 . That keeps the stock inside a positive GEX regime for now — as long as this zone holds, price action tends to stay more controlled than in a negative gamma environment below HVL.
This matters because the current move is not a breakdown yet — it is a retracement within a broader uptrend , with p
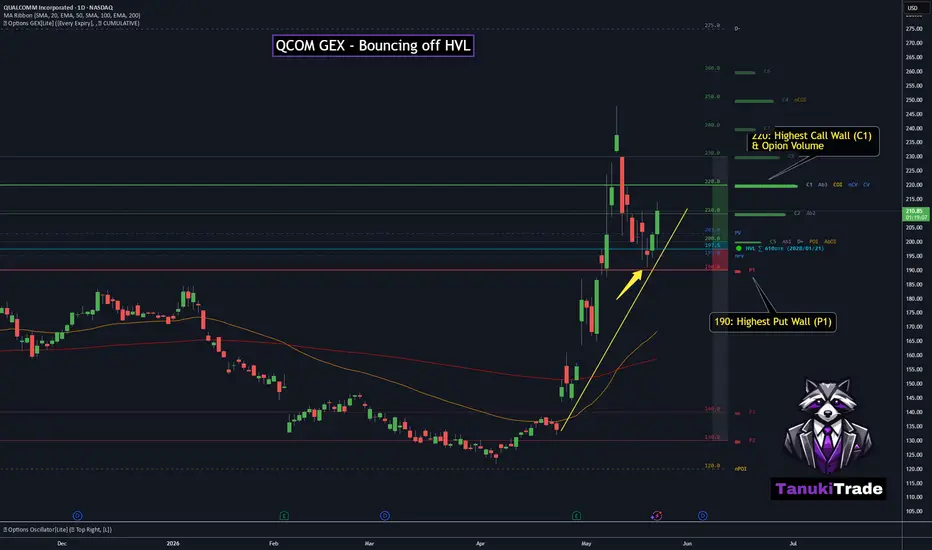
QCOM – Bounce from HVL, Watching 220 Call Wall ConfluenceQCOM is showing a constructive bounce from a key options-driven regime level.
On the daily chart, price recently reacted from the 197.5 High Volatility Level (HVL) and is now continuing within an upward trend structure after a healthy pullback.
This matters because HVL often acts as a key regime pivot. As long as price holds above this zone, QCOM remains in a more constructive gamma environment, where volatility can become more controlled compared to reactive downside conditions.
🔶 Options St
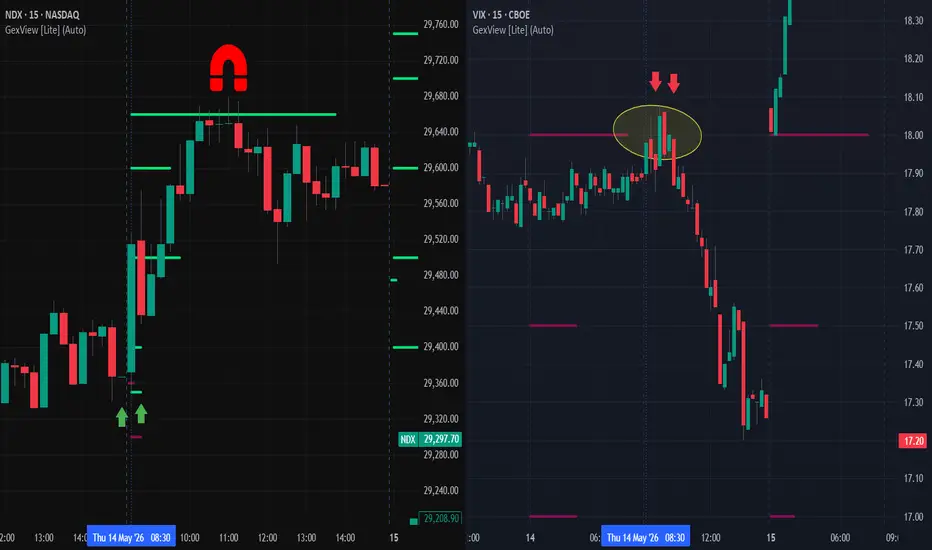
Gamma Exposure Pattern: 0DTE NDX+VIXThis example is from May 14, 2026.
My setup is based on Gamma Exposure (GEX):
1. Left Chart
Ticker: Nasdaq 100 Index ( NASDAQ:NDX )
Gamma Exposure: 0DTE (expiration: May 14, 2026)
Time Trigger: Regular Trading Hours (RTH) opening
Target: The largest 0DTE GEX level at 29,660, which tends to act as a magnet price level.
2. Right Chart
Ticker: Volatility Index ( CBOE:VIX )
Gamma Exposure: Nearest expiration (May 19, 2026)
Pattern: A false breakout in CBOE:VIX above the largest GEX level
SPX – Bullish Rally Above HVL, 7500 Call Wall in Focus🔶 SPX – Bullish Rally Above HVL, 7500 Call Wall in Focus 🔶
SPX is currently trading in a very strong bullish rally, with price moving firmly above the High Volatility Level (HVL).
For the May 15 expiration, HVL is now sitting far below current price, around the 7300 area, which means SPX remains well inside a positive GEX regime.
In this type of environment, price action often becomes more controlled, and upside momentum can continue as long as the structure remains supportive.
🔶 Current Op
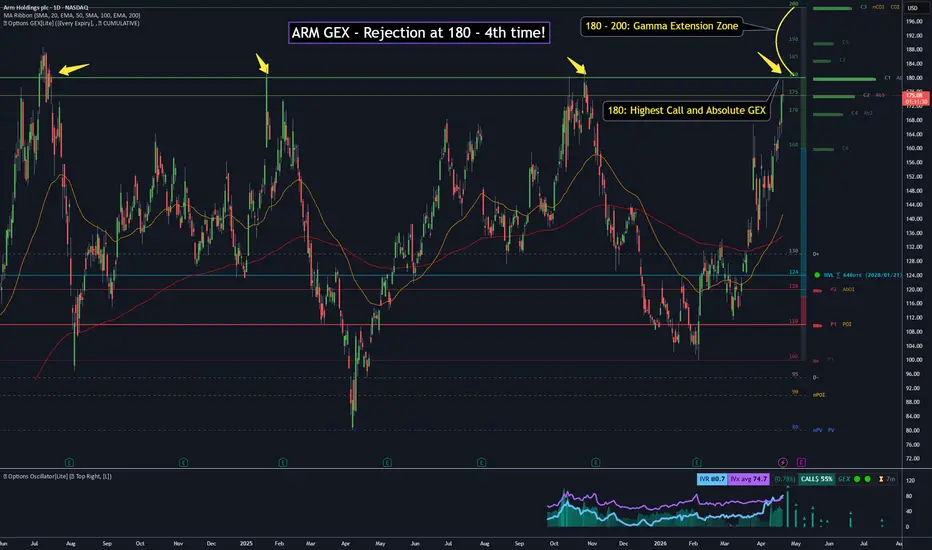
ARM GEX - Rejection at 180 - 4th time!ARM is still trading comfortably above HVL, so we remain in a positive gamma environment. That usually means more controlled price action and less aggressive directional expansion.
What stands out right now is the 180 level (C1).
On the daily chart, this is now roughly the fourth test of the same level, and each time price has been rejected. The latest move into C1 again resulted in a clean rejection from the highest net GEX concentration.
That’s not random — that’s structure holding.
If you
SPX: New All-Time High — With a Little Help from GEXDid you see it coming?
If you feel nervous during every trading session—constantly second-guessing your decisions—you’re not alone. But instead of wasting time and money, consider focusing on what truly matters: Gamma Exposure.
Take a look at the chart. No annotations, no moving averages, no trend lines—just Historical Gamma Exposure levels. It’s as if we’ve laid all the cards on the table.
The first thing to notice is the classic V-shaped rebound. But why did it happen? Honestly, we don’t
ULong
What drives SPY market when volatility crashes?Last week, the S&P 500 jumped 3% after a ceasefire announcement. It looked like everyone got confident again . Volatility (VIX) dropped below 20 — one of the biggest one-day drops ever.
But here's the catch.
That rally wasn't about good news. It was about vanna🧐.
What's vanna? It measures how falling volatility changes option deltas. When volatility crashes, dealers who were shorting stocks to hedge puts no longer need to. So they buy back those shorts — and prices go up.
That's exactly w
SPX GEX – Watching for HVL SPX has recently bounced from the 6350 technical support.
Price is now moving higher and approaching the HVL area again, where a potential shift between volatility regimes could occur.
This is where things get interesting.
🔶 Options Structure Context 🔶
6250 – next put wall / downside support
6510 (HVL) – volatility regime pivot
6605 – major call wall / upside reference
Below HVL, the market typically trades in a negative gamma regime, where price action is more reactive and volatility tends
Gamma Exposure Report: Is 450 a Magnet for GLD?PEPPERSTONE:XAUUSD
Long-term trend: Bullish
Key question: Is the current structure an accumulation near all-time highs, or the beginning of a distribution phase?
Macro backdrop: War and inflation — both supportive of gold.
My view based on gamma exposure ( AMEX:GLD GLD):
Watch the 450 level closely. This level has been building steadily over the past week, growing day by day, and could act as a price magnet . 🧲
Should I be preparing to sell? Probably not. Instead, I would wait for p
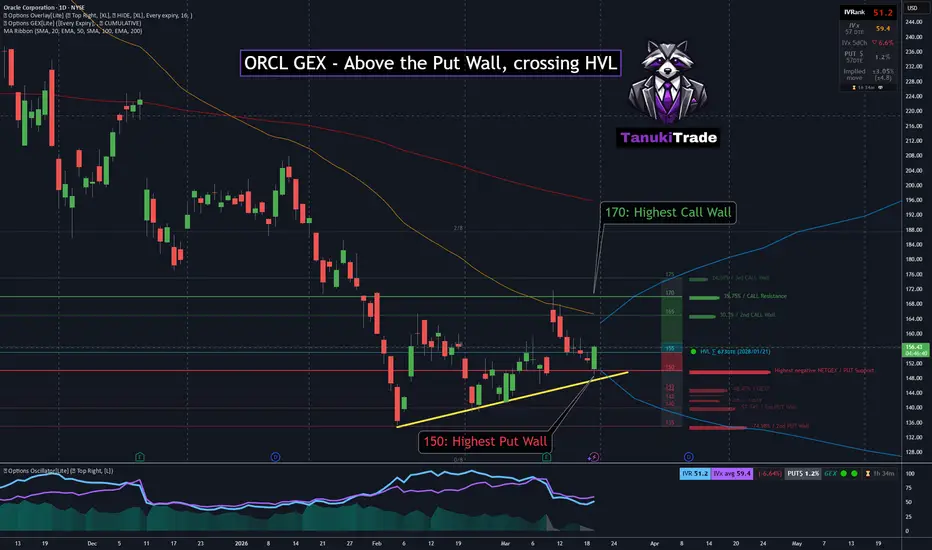
ORCL GEX - Above Put Wall, crossing HVL🔶 Trendline Support Holds, Price Reclaiming HVL into Positive GEX Zone 🔶
The chart is showing a developing stabilization attempt after a recent decline.
Price has been respecting an ascending trendline from the 135 area up toward 150, providing a clear structural support for the current move. This trendline now acts as a key reference for short-term momentum.
At the same time, price is trading above the 150 put GEX level, which represents the largest downside positioning level and reinforces
AAPL GEX - Testing HVL in a Volatile Regime🔶 AAPL – Holding Above 200 EMA, Testing HVL in a Volatile Regime 🔶
AAPL is currently sitting at a key technical and options-driven inflection point.
On the daily chart, price recently bounced from the 200-day moving average, forming a short-term double bottom structure while continuing to respect an ascending trendline. This area now acts as an important support zone for the current structure.
However, price is currently trading just below the High Volatility Level (HVL), which sits around 25
USO: Extreme Call Pricing Skew🔶 USO – Explosive Gap Up, Extreme 500% Call Skew Appears 🔶
USO, the oil ETF, is experiencing an unusually aggressive move higher.
The market opened today with a massive 8% gap up, continuing the strong upside momentum driven by escalating geopolitical tensions involving Israel, Iran, and the United States. Moves of this magnitude are rare for USO and immediately push options positioning into extreme territory.
🔶 Options Structure 🔶
The current GEX profile highlights two major positioning anc