Long
Long
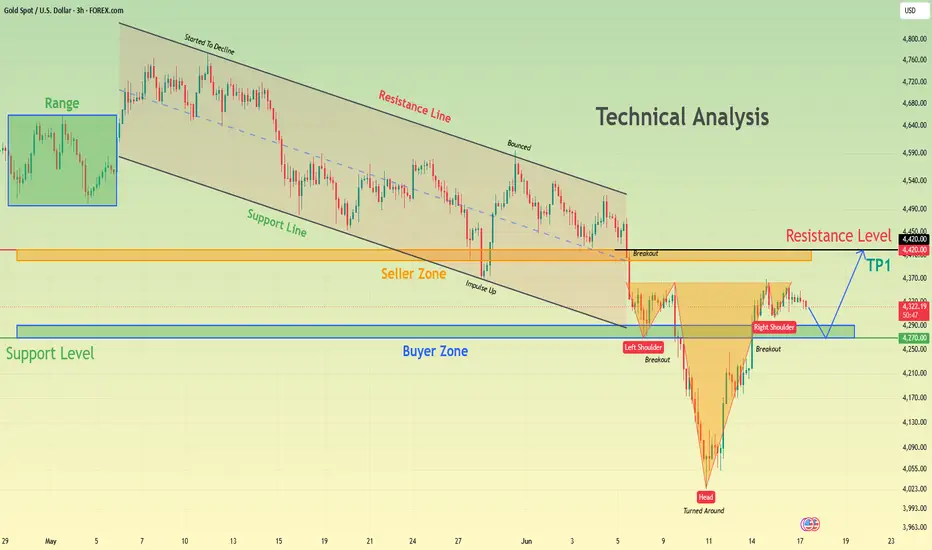
XAUUSD (Gold) 4H | Head & Shoulders Pattern Analysis – Potential
This educational chart highlights a classic Head and Shoulders reversal pattern forming on XAUUSD (Gold) on the 4-hour timeframe. After a strong bullish rally, price entered a major resistance zone and created three distinct peaks: the Left Shoulder, Head, and Right Shoulder, signaling weakening bullish momentum and the possibility of a trend reversal.
The current market price is trading around 4260, positioned near the critical Neckline Zone (4340–4360). This level acts as a key decision area for the market. A confirmed break and close below the neckline could indicate a shift from bullish to bearish market structure, opening the door for further downside movement.
The resistance zone between 4440–4480 has repeatedly rejected price, showing strong selling pressure from higher levels. As buyers struggle to push above the previous highs, the formation of the right shoulder suggests that demand may be fading. This is a common characteristic of Head and Shoulders patterns before a potential breakdown occurs.
If sellers gain control and price breaks below the neckline with strong momentum, the next downside objective may be the Target Support Zone (4120–4160). Traders often wait for a neckline breakout and retest confirmation before considering a bearish continuation setup. Until that confirmation occurs, the pattern remains a developing educational example rather than a confirmed signal.
This chart demonstrates the importance of combining chart patterns, support and resistance zones, and market structure analysis when evaluating potential trade opportunities. Understanding how Head and Shoulders patterns form can help traders identify possible trend reversals and manage risk more effectively.
🎓 Key Learning Points
✅ Head and Shoulders = Potential Reversal Pattern
✅ Resistance Zone showing repeated rejection
✅ Neckline acts as key confirmation level
✅ Breakdown + Retest provides stronger confirmation
✅ Market structure is more important than prediction
Always use proper risk management
Disclaimer: This chart is shared for educational purposes only and should not be considered financial advice. Always conduct your own analysis and manage risk before making trading decisions.  Short
Short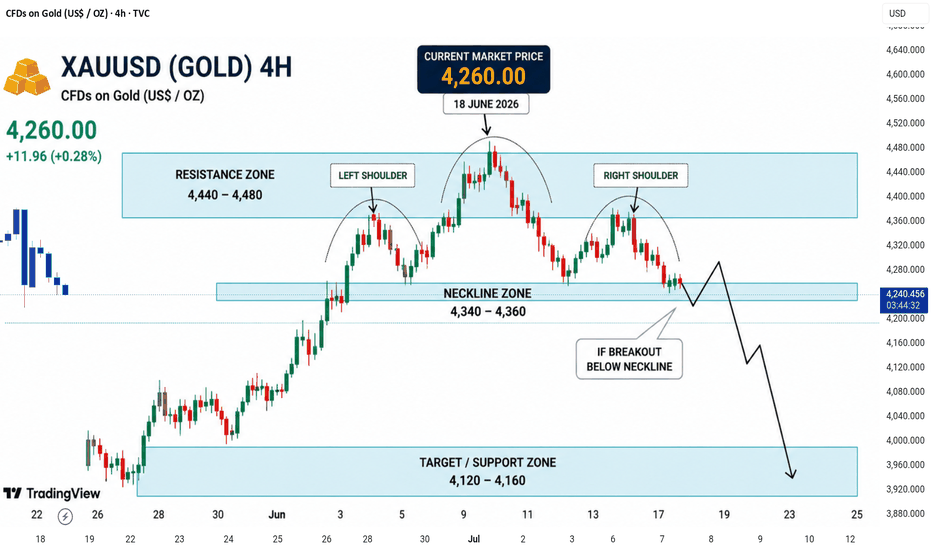
 Long
Long
Long 
Long 
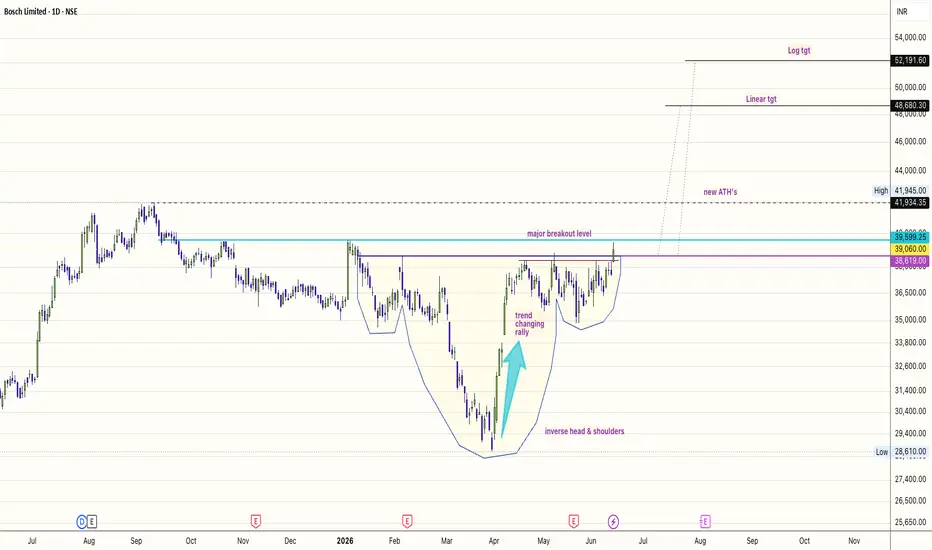
$BOSCHLTD: Inverse H&S Breakout🏎️ 📈 🚘 💎 🚀
The Macro Setup: Structural Accumulation CompleteLook at the daily chart.
What we are witnessing is a textbook, massive Inverse Head & Shoulders pattern that has been grinding out its accumulation phase since mid-last year.
The Footprint: We saw a definitive trend-changing rally off the 28,600 structural low, followed by a tight, symmetric right shoulder consolidation.
The Breakout: Bosch has cleanly cleared the major breakout level at 39,599, piercing right through local resistance blocks with accelerating momentum.
With price breaking out into new All-Time Highs (ATHs), the overhead supply is completely wiped clean.
This sets up a highly asymmetric expansion phase for the second half of this calendar year.Why Bosch Commands (and Deserves) a Premium Many market participants mistakenly value auto-component players on a linear curve.
Bosch defies this by consistently commanding a steep scarcity premium.
As the industry transitions into advanced powertrain technology, electronics, and stricter safety standards, Bosch isn't just a supplier—they own the core architecture.
Their deep engineering moat justifies every bit of their premium multiple.
1. The MNC Moat vs. Domestic Suppliers
The core of Bosch’s dominance lies in the unique Multinational Parent vs. Domestic Supplier dynamic:Global R&D Leverage: Local domestic suppliers have to build proprietary tech from scratch or pay massive licensing fees.
Bosch India simply plugs straight into the global parent company's multi-billion dollar engineering ecosystem.
The Tech Transition: Whether it’s advanced electronic control units (ECUs), driver-assistance software, or complex fuel-injection systems, the global parent has already battle-tested the technology in Western markets.
Bosch India can localise and deploy these premium products at a speed and margin structure that purely domestic peers cannot match.
Tier-1 Sticky Relationships: Global automotive OEMs demand uniformity across regions. Because Bosch is embedded at the global design level for these manufacturers, they naturally capture the highest-margin component share when those models are manufactured or updated domestically.
2. The H2 Catalyst: Content per Vehicle Tailwinds
The second half of this calendar year will be driven by a massive structural trend:
Premium-isation.
The shift in consumer demand toward premium SUVs and high-spec vehicles plays directly into Bosch’s hands.
As OEMs shift their production mix toward higher-end trims, the dollar-content per vehicle supplied by Bosch scales exponentially.
They aren't just selling more units; they are selling vastly more expensive, tech-heavy systems into every vehicle rolling off the assembly lines.
The Targets & Execution
The breakout confirmation opens up clear outside expansion space:
Immediate Play: Retests of the 39,000–39,600 neckline zone are for aggressive buying.
Linear Target: $48,680
Logarithmic Target: $52,191
TSX:THE accumulation block is broken. Capital is rotating into pure quality.
Disclaimer: This is for educational and idea-sharing purposes only.
#BOSCH #AutomotiveTech #SwingTrading #PriceAction #Breakout #TradingView #ChartPatterns #NiftyAuto #ValueInvesting #TechnicalAnalysis
Manage your risk coordinates dynamically.  Long
Long
Long 
Mazagon Dock Shipbuilders Ltd. – Elliott Wave ABC CorrectionMazagon Dock appears to have completed a five-wave impulsive decline (1-2-3-4-5) from its previous highs, followed by the beginning of an ABC corrective structure. Wave A has already unfolded, and the recent bounce from Wave B support suggests that Wave C may now be underway.
An important observation is that price has respected the long-term rising trendline, indicating that buyers are defending higher levels. If Wave C extends as projected, the stock could revisit the major supply zone around ₹2,900–3,000.
Technical Observations:
🔹 Completed 5-wave bearish impulse structure
🔹 ABC corrective phase in progress
🔹 Wave B support held successfully
🔹 Long-term rising trendline remains intact
🔹 Potential Wave C target near the previous resistance zone
Trading Plan:
✅ Bullish above recent swing lows
🎯 Target Zone: ₹2,900–3,000
🛑 Key Support: ₹2,400–2,450
The current structure suggests that the stock may be transitioning from correction to recovery. A sustained move with increasing volume could confirm the continuation of Wave C toward the highlighted target area.
Disclaimer: This analysis is purely for educational purposes and should not be considered investment advice. Always manage risk appropriately before taking any trade.
 Long
Long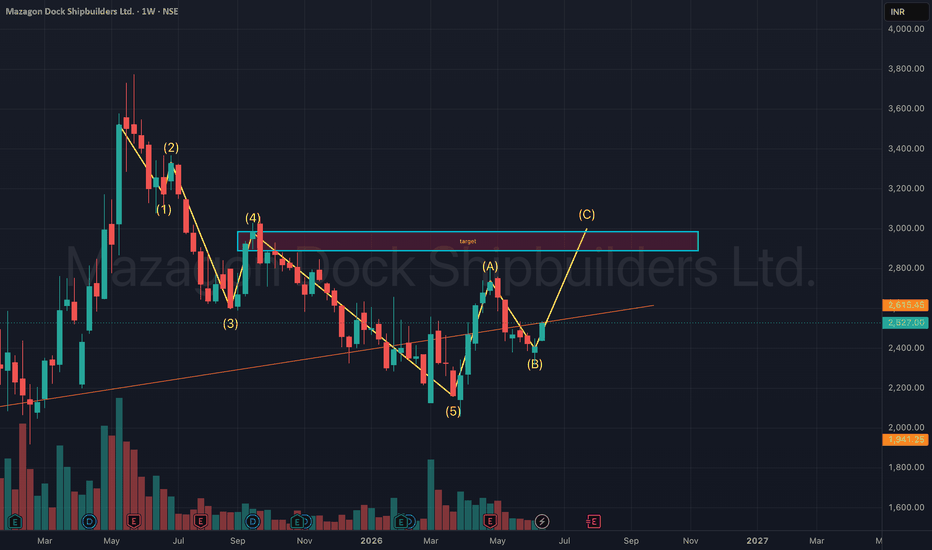
Long 
MESU June 16: Watch 7606 pullback, then 7650 and 7695MESU analysis for Tuesday, June 16
We’ve now rolled from the M contract into the U contract, so today’s focus is on MESU.
MESU has been consolidating overnight around 7630, and I still lean bullish for today as long as the key support structure holds.
On the 4H chart, the main support level for me is 7582. If bulls want to stay in control, then I do not want to see price lose that level. Just above it, I can also see a fair value gap around 7600, which may act as support on a pullback.
The first upside target I’m watching is the yesterday high at 7650. If bulls can push through that level, then the next target for me is the all-time high around 7695.
On the 1H chart, 7606 stands out as the key near-term pullback level. If price retraces first, I want to see how it reacts there.
On the 15M chart, the fair value gap and order block align in the green zone, so that is the main setup area I’m watching for confirmation.
Key levels
7606 = near-term pullback level
7582 = must-hold support
7650 = first upside target
7695 = all-time high / second target
Green zone = FVG + order block reaction area
Plan for today
Stay constructive while price holds support
Watch for pullback into 7606 / green zone
If buyers confirm there, watch 7650 first
If bulls stay strong, watch 7695 next
Reassess if price loses 7582
Not financial advice. No confirmation, no trade.
If you want, I can also make these more shorter and punchier for faster posting, or keep them in this style by default. CME_MINI:MESU2026  Long
Long
Short 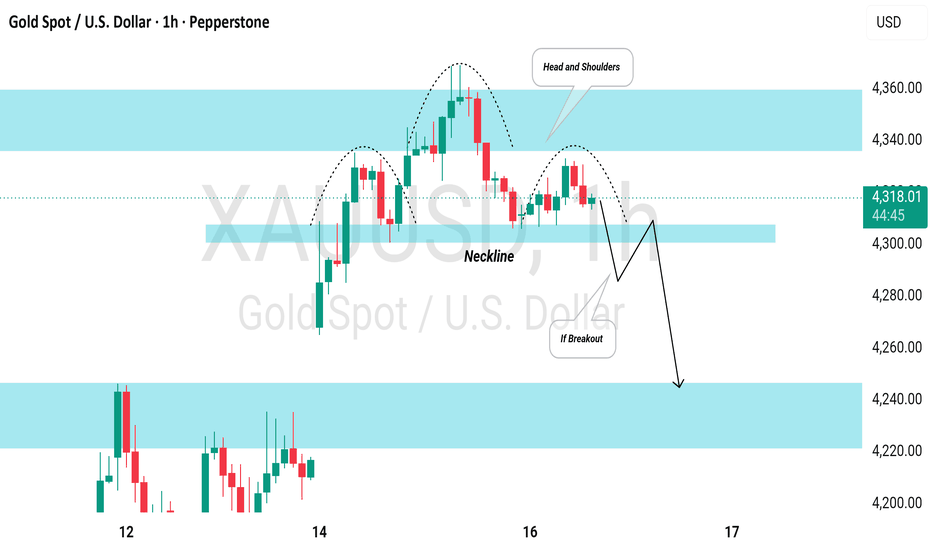
 Long
Long
 Short
Short
MESM June 15: Watch 7473 pullback, then 7610 breakoutMESM analysis for Monday, June 15
MESM gapped up overnight and is trading around 7533. The move looks strong, and price is now trading inside the last part of the 4H order block.
For me, the main upside liquidity is sitting around 7610. If bulls can push through that level and get a confirmed close above it on the 4H chart, then I think price could continue higher toward a bigger upside target around 7700.
At the same time, I still respect the chance of a pullback first. The key level I’m watching for that retracement is 7473, which also lines up with the neckline of the inverse head and shoulders on the 1H chart.
So for today, my plan is:
Watch for a pullback into 7473
If price holds that level, watch for continuation higher
7610 = first major upside target
7700 = bigger breakout target if momentum continues
Key levels
7473 = neckline / pullback support
7610 = first upside liquidity
7700 = larger breakout target
Not financial advice. No confirmation, no trade. CME_MINI:MESM2026 Long 
Short 
 Short
Short
 Short
Short
MESM June 12: Mother bar low at 7375 is keyMESM analysis for Friday, June 12
MESM printed a 4H mother bar, and for today that slightly shifts my tone toward a bounce setup, but only as long as the key support level continues to hold.
On the 4H chart, the most important level for me is 7375, which is the low of the previous 4H mother bar. As long as price stays above that level, I think the bounce setup remains valid.
If bulls stay in control, then the first upside target I’m watching is 7491. If price can push through that level, then the next upside target is the 4H gap around 7532.
If price loses 7375, then I think the bounce idea weakens and price could continue lower toward 7330.
On the 1H chart, the structure supports the same idea. 7375 is still the main line in the sand. If price revisits and loses that level, selling pressure could step back in.
On the 15M chart, there is also a lower fair value gap / order block lining up in the green zone below, which could become the next reaction area if price breaks down.
Key levels
7375 = low of the 4H mother bar / key support
7491 = first upside target
7532 = 4H gap / second upside target
7330 = downside target if support fails
Lower green zone = possible reaction area if price breaks lower
Plan for today
Slightly bullish while price holds 7375
Watch 7491 first on the bounce
If bulls stay strong, watch 7532 next
If price loses 7375, watch for downside toward 7330
Not financial advice. No confirmation, no trade. CME_MINI:MESM2026 Long 
 Long
Long