Long
Long
Bitcoin enters week Gaussian channel - September 2026Next stop: $95-96k with 100% probability.
Do you remember this idea?
At that time price action printed a candle body inside the channel around 101k on the weekly chart. Fairly unpopular amongst the Bitcoin maxis to tell them precious was going down.
Price action has now confirmed the channel once more. And the 100% ??
“At its core statistics is not about cleverness and technique, but rather about honesty.”
as my professor in operational research used to quote me.
Statistics also say most people die in hospital.. so stay away from hospitals. It’s not wrong, but you go there when you need to and people buy market tops because they must. Ask the maxis.
The also sell the bottoms, just like Tech lead..
If you can bring yourself to part with the fundamental mumbo jumbo, I’ll lay on the facts. Facts with confluence.
The Gaussian channel on the week after a bull / bear market.
Each of the weekly charts below has price action entering the channel after:
The end of a bull market
The end of a bear market
The all make this distinction short after the recently reported death cross. The would be the confluence mentioned earlier.
March 2023
April 2019 & March 2020
October 2015
But there’s more, $95-96k, why are you so certain?
That annoying subject again, statistics. Some say this is no strategy at all. You know who you are. Take another glance at the above charts, what do you see?
Every time price action enters AND confirms the entry (it has), price action will continue until the upper side is tested. Most assets do this, stock, crapto, Bonds, price of Hong Kong fishcakes. For the high majority of the time the statistic will play out. Bitcoin has a track record of 100% as measured throughout all price action history available.
Summery, no short selling amigo.
Is $95-96k the next market top?
No.
Do you know what it is?
Certainly do. A flex not many can make. Annoying isn't he?
It was the exact same process used to call the market to at strike120k from around 18k.
Do you know what that process was?
Some of you do, some of you don’t. If you’re meant to know, you will. If not, social media has done its work on you.
Is it possible for price action to reverse and test the lows? For sure.
Is it probable? No.
Ww
====================================================
Disclaimer
Past observations are evidence, not guarantees. A statistical pattern can have a 100% historical hit rate and fail on the very next observation. That's statistics. Irritating, isn't it?
Markets contain risk. Bitcoin contains quite a lot of it. Price can rise, fall, reverse, collapse, overshoot, undershoot, or spend three weeks doing absolutely nothing simply to make everyone involved look stupid. So don't buy because I said $95-96k. Don't sell because I said $95-96k. Don't leverage your grandmother because I said $95-96k.
Do your own analysis, understand your risk, and make your own decisions. And if Bitcoin doesn't reach $95-96k, congratulations: you've just witnessed the historical statistic change from 100%.
Science marches on.  Long
Long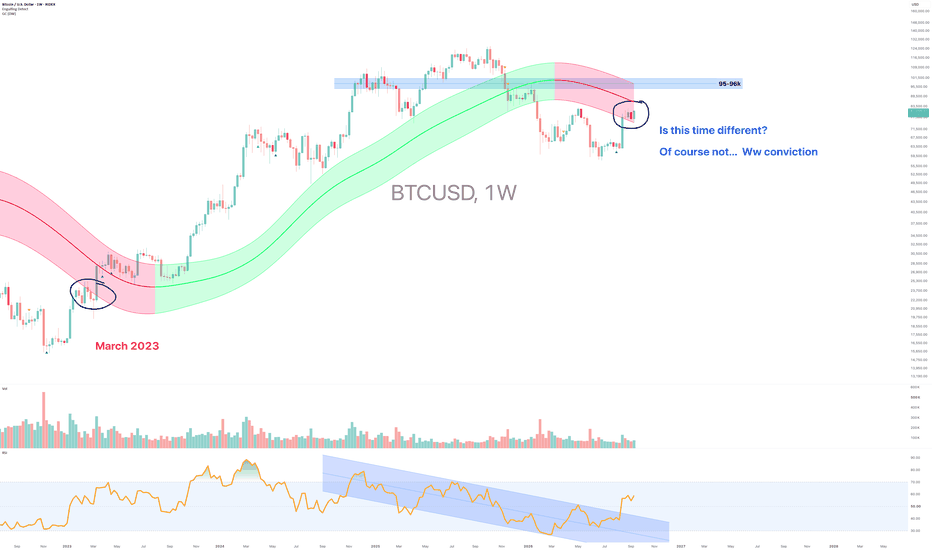
 Long
Long
 Long
Long
 Long
Long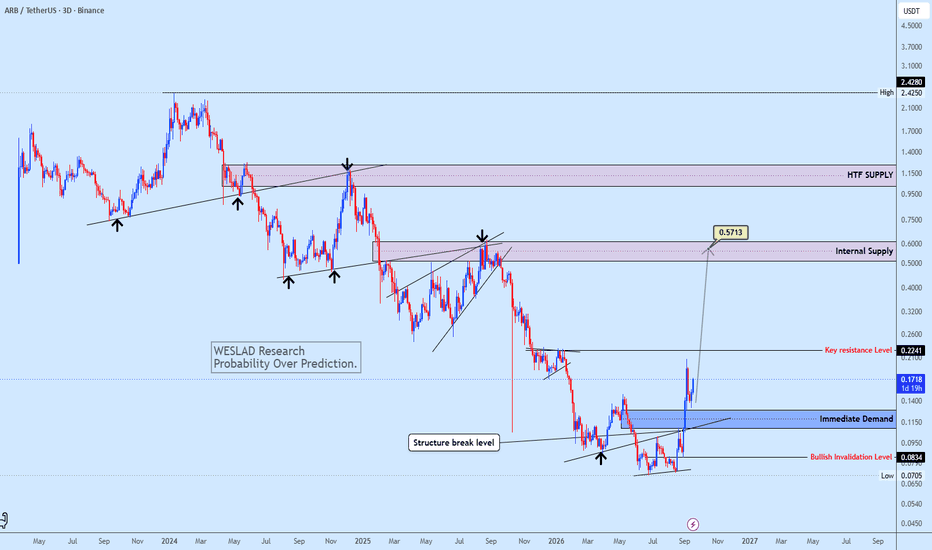
XAU/USD 18 September 2026 Intraday AnalysisH4 Analysis:
-> Swing: Bullish.
-> Internal: Bearish.
Bias and analysis to remain the same as analysis dated 30 June 2026.
Price did not print bullish CHoCH to indicate bullish pullback phase initiation. Price instead printed a new low followed by a bullish CHoCH
Price is currently trading within and established internal range, however, I will continue to monitor price with respect to depth of pullback.
Intraday expectation:
Price to trade up to either premium of internal 50% EQ, or H4 demand zone before targeting weak internal low, currently priced at 3,942.100.
Note:
Gold remains volatile as tensions between the US, Israel, and Iran keep safe‑haven demand elevated.
Markets are reacting quickly to every headline, while uncertainty around the Fed’s easing path and shifting U.S. policy under President Trump, especially tariffs continues to fuel choppy price action.
For newer traders, the key is simple, stay flexible and manage risk carefully, as fast spikes and sudden reversals are a normal part of the current XAU/USD environment.
H4 Chart:
M15 Analysis:
-> Swing: Bearish.
-> Internal: Bullish.
Price has printed according to yesterday's analysis dated 17 September 2026 whereby I mentioned, in intraday analysis, due to the narrowing of the internal range, price could potentially strong internal high and print a bullish iBOS as we are also seeing a drastic reduction in the depth of the internal range.
Price is currently trading within an internal low and fractal high. CHoCH positioning is the same as the fractal high. CHoCH positioning is denoted with a blue dotted horizontal dotted line.
Intraday expectation:
Price to trade down to either discount of internal 50% EQ, or M15 supply zone before targeting weak internal high, currently priced at 4,399.670.
Note:
Gold remains highly reactive on M15 as geopolitical risk continues to drive quick, headline‑led moves.
The tension between the US, Israel, and Iran is keeping safe‑haven demand elevated, with markets still sensitive to any sign of escalation.
At the same time, shifting US tariff policy under President Trump is adding extra uncertainty, fuelling sharp intraday swings and increasing the likelihood of sudden sentiment flips. Liquidity pockets and whipsaws remain common, making disciplined risk management essential.
Gold’s geopolitical premium is still firmly in place, and until tensions ease, short‑term volatility is likely to stay front‑loaded.
M15 Chart:

PONKE AT MAKE-OR-BREAK SUPPORTYello, Paradisers! Is PONKE about to trap impatient bears at one of the most important support zones on the chart before attempting a much stronger upside expansion?
💎PONKEUSDT is currently trading around $0.0207 after another rejection from the upper boundary of the 4H falling wedge. While the lower timeframes remain bearish, the bigger picture is becoming increasingly interesting because price has once again reached a major Daily support area around $0.0198–$0.0186.
💎What makes this zone especially important is the market structure developing around it. PONKE has now tested approximately the same support area three times, creating a potential triple-bottom structure. At the same time, this support also aligns with the lower boundary of the falling wedge and an important former Daily resistance zone that is now being tested as support.
💎This creates a clear conflict between the timeframes. The 1H and 4H structures remain bearish, meaning there is still no confirmed short-term reversal. However, the Daily and Weekly structures remain bullish, which is why aggressively chasing shorts directly into this support would carry significantly worse risk-to-reward.
💎For the bullish scenario to gain confirmation, PONKE first needs to hold the current support and reclaim the falling-wedge resistance. Above that, the $0.0230–$0.0235 region becomes the next important obstacle, where the 4H resistance and high-volume trading area are located.
💎A successful breakout and acceptance above this region could open the way toward the next major Daily resistance zone around $0.0270–$0.0280. That would represent a meaningful expansion from the current price and could quickly bring momentum back into the market.
💎However, confirmation matters. A temporary bounce from support is not enough to declare the correction finished. Until PONKE breaks the falling wedge and starts closing above the nearby resistance levels, the short-term bearish structure technically remains intact.
💎The bullish thesis becomes significantly weaker if price loses the $0.01801 support area on a confirmed candle closing basis. Such a breakdown would invalidate the current triple-bottom idea and indicate that sellers remain in control.
💎This is exactly the type of situation where patience becomes more valuable than prediction. The potential upside is attractive, but entering before confirmation means accepting unnecessary risk. Professional traders do not need to catch the exact bottom; they need to participate when the probabilities become favorable.
Strive for consistency, not quick profits. Treat the market as a businessman, not as a gambler. Discipline, patience, and waiting for confirmation are what keep traders inside the winner's circle.
MyCryptoParadise
iFeel the success🌴  Long
Long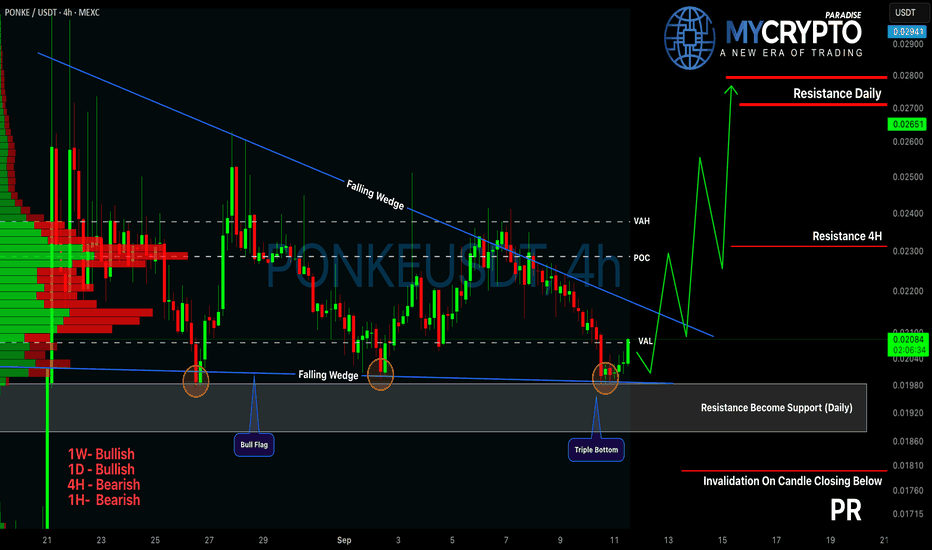
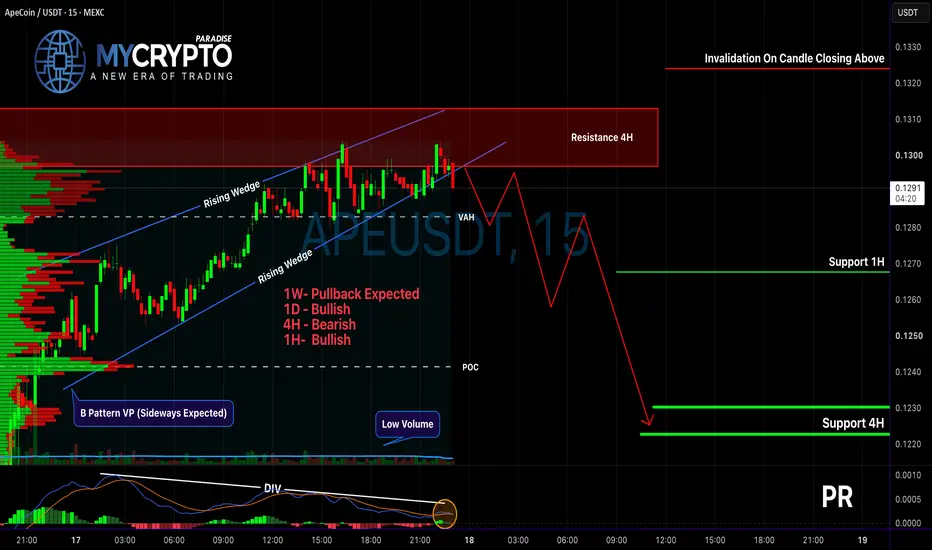
APE Bulls Running Out of Time?Yello, Paradisers! Are #APEUSDT bulls about to get trapped right below a major resistance zone before the market delivers the pullback most traders are not prepared for?
💎#APEUSDT is currently trading around $0.1296 after pushing directly into an important 4H resistance area around $0.1297-$0.1313. At the same time, the price continues to respect a rising wedge structure on the 15-minute timeframe, which puts the market in a very sensitive position.
💎The short-term structure remains bullish while #APE holds the lower boundary of this wedge. However, the bigger picture is much less straightforward. Our 1D structure remains bullish, while the 4H structure is bearish, and on the 1W timeframe we are still expecting a pullback. This timeframe conflict is exactly why aggressively chasing the current move would carry unnecessary risk.
💎Another important factor is volume. The latest upside movement has developed on relatively low volume while APE is approaching resistance. This tells us that buyers have pushed the price higher, but the move is not showing particularly strong participation. We can also see weakening momentum around the highs, adding further caution while the price trades directly underneath resistance.
💎The volume profile strengthens this scenario. APE is currently trading above the Value Area High around $0.1282, while the Point of Control sits considerably lower around $0.1241. When price stretches above an important value area without strong continuation volume, a rotation back toward lower liquidity levels can become increasingly relevant.
💎As long as APE remains underneath the 4H resistance zone, we are watching for the possibility of rejection and a breakdown from the rising wedge. The first important downside area is the 1H support around $0.1268. If sellers manage to break that level with confirmation, attention can shift toward the major support and liquidity area around $0.1223-$0.1230.
💎However, we are not blindly bearish. A confirmed candle close above approximately $0.1324 would invalidate this bearish scenario and show that buyers have successfully absorbed the resistance.
💎This is exactly the type of market structure where patience becomes more valuable than prediction. APE is sitting between short-term bullish momentum and higher-timeframe resistance, meaning the next confirmed breakout or breakdown can provide much cleaner information than trying to anticipate every small move inside the current range.
Strive for consistency, not quick profits. Treat the market as a businessman, not as a gambler. Wait for confirmation, respect invalidation, and protect your capital because disciplined execution is what keeps traders inside the winner circle.
MyCryptoParadise
iFeel the success🌴  Short
Short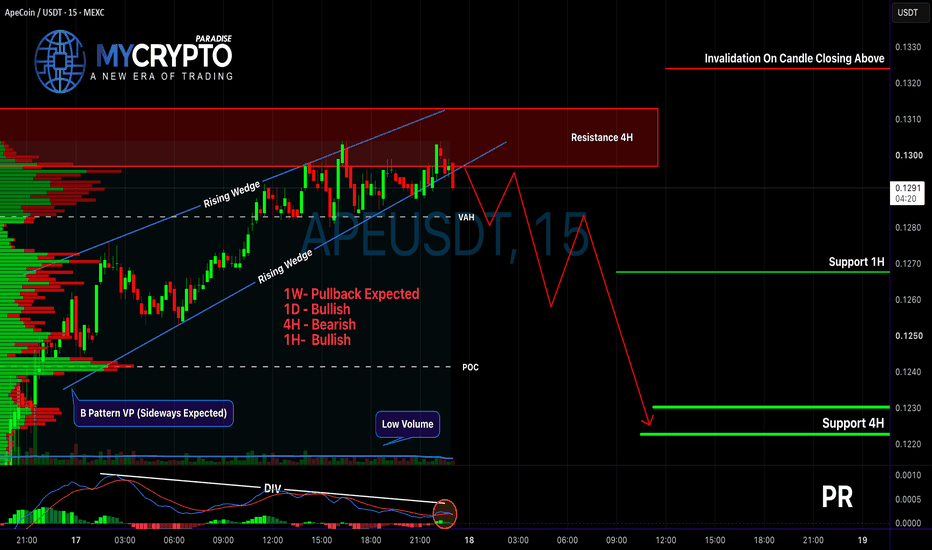
EUR/USD — Larger Correction or the Continuation of the Bullish T⏱️ Reading Time: ~4 minutes
On the EUR/USD chart, price is currently at an important point within the larger-term structure.
From the 1.60360 peak, a major bearish structure developed into the 0.95356 low. Since then, EUR/USD has produced a significant recovery.
The key question now is whether this recovery is still part of a larger correction, or whether it is developing into the beginning of a larger bullish trend.
🟦 Bullish Scenario — A Larger Uptrend
In the turquoise scenario, the advance from the 2022 low still has room to develop further to the upside.
The larger structure can potentially be interpreted as:
(W) – (X) – (Y)
Wave (W) is considered a Simple Zigzag, followed by corrective Wave (X).
The current X-Wave may still need more time and price development before it is complete. Therefore, the current fluctuations do not necessarily invalidate the larger bullish structure.
If Wave (X) completes and price develops the next bullish structure clearly, Wave (Y) could produce another significant advance.
In that case, the structure could eventually open the path toward higher levels, including the 1.30–1.35 area shown on the chart.
However, this scenario still needs confirmation from the internal price structure rather than simply reaching a target.
⚫ Bearish Scenario — A Larger and Deeper Correction
The black scenario presents a different interpretation.
Under this view, the entire recovery from 0.95356 may still be part of a much larger correction against the previous bearish structure.
If the recovery develops as a Double or Triple Zigzag, some of the strong rallies along the way can still remain corrective in the larger degree.
Even a five-wave advance on a lower degree would not automatically mean that the larger correction is finished.
Under this interpretation, another major bearish leg could eventually develop.
The lower areas marked on the chart, including:
1.01765–1.03575
0.92853
0.86220
would then become important areas for monitoring the larger bearish structure.
🔎 The Key Structural Question
The real difference between these two scenarios is not simply the next direction of price.
It is the degree and character of the advance from the 2022 low.
If EUR/USD continues to develop clear impulsive five-wave structures on the upside, followed by proportional corrections, the bullish scenario gains structural support.
But if the market continues producing overlapping three-wave structures, the possibility remains that the entire recovery is still part of a larger corrective sequence.
This is where the Double Zigzag / Triple Zigzag interpretation becomes particularly important.
🌍 EUR/USD & DXY
The EUR/USD structure can also be monitored alongside DXY.
Dollar weakness can generally support EUR/USD strength, but the two markets do not need to move as perfect wave-by-wave mirrors.
DXY can provide useful intermarket confirmation, while the EUR/USD count still needs to prove itself through its own price structure.
Conclusion
For now, the 🟦 turquoise scenario considers the possibility of a larger bullish continuation. If Wave (X) completes, the next bullish leg could develop as Wave (Y) and potentially become part of a much larger bullish structure.
Meanwhile, the ⚫ black scenario considers the possibility that the recovery from 2022 is still part of a larger Double or Triple Zigzag, leaving room for another significant bearish leg.
So the key question is:
Is EUR/USD building a larger bullish trend, or is the recovery still part of a larger corrective structure?
We don't need to force the answer.
Price will build the structure, and the structure will tell us which scenario remains valid.
Best Regards,
Mr. Nobody
Elliott Wave Analyst & Financial Researcher
– Patterns whisper. I listen. – Mr. Nobody 🎧📊
Euro / U.S. Dollar
Feb 6, 2025
EUR/USD – Bullish Wave & Invalidation Zone
British Pound / U.S. Dollar
Feb 6, 2025
GBP/USD Elliott Wave Analysis – Major Breakout Ahead?
 Long
Long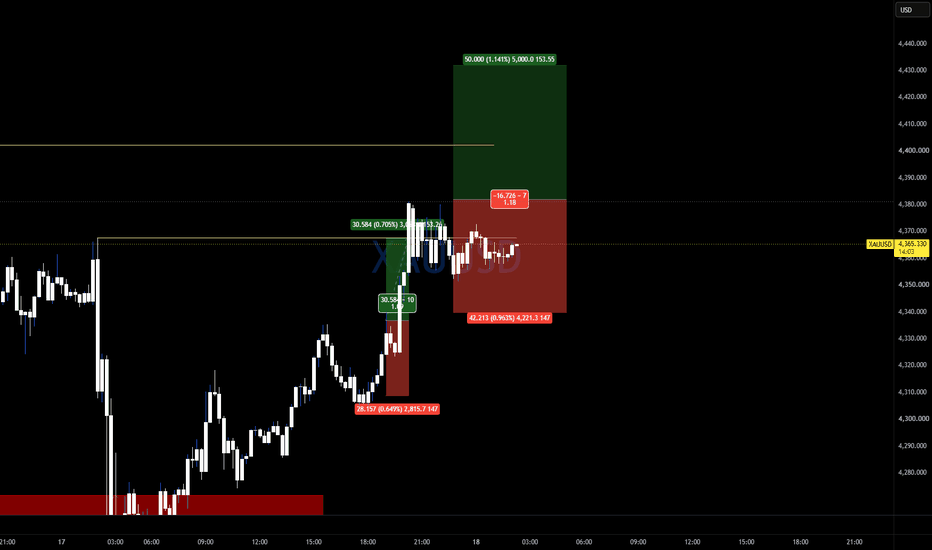
NEAR - The Double Bottom nobody wants to buy - March 2026Ninety four percent down from its all-time high. Trading at levels first seen in early 2021. And the crowd? They’re busy chasing meme coins like SOL and XRP while completely blind to the fact that NEAR is sitting on one of the cleanest macro double bottoms in the entire crypto market. Nobody is interested. Perfect.
On the above 8-day chart NEAR has retested the $1.05–$1.10 support/resistance zone, the exact same level that held as support in early 2021 before launching a 2,800% rally to the all-time high. It held again in mid-2024 and produced a 700% move to $8.00. The crowd sold that rally all the way up. They are selling this retest too. A number of reasons now exist to take the other side of that trade. They include:
1) Macro double bottom on multi-year support. The blue band on the chart marks the $1.05 to $1.10 zone. Two tests, circled on the chart, separated by over three years, each followed by explosive rallies. This is not a coincidence. This is market memory. When a level holds twice on this timeframe, you pay attention. When it holds twice and launches four-digit percentage moves both times, you do more than pay attention.
2) RSI breakout and higher high. Look at the lower panel. RSI has been compressing inside a descending wedge since mid-2024, narrowing, coiling, building energy. It has now broken out of that wedge and printed a higher high. This is the first confirmed momentum shift on the 8-day timeframe since the decline from $8.00 began. When RSI breaks structure before price does, price follows. That is not opinion. That is how momentum works.
3) Measured move: 180% to first resistance. The chart marks it clearly. From the current $1.05–$1.17 zone to the first horizontal resistance at approximately $3.00, roughly 180%. To the second resistance at approximately $3.60, roughly 254%. These are not speculative extrapolations. They are horizontal levels where price has previously consolidated and reversed. Structure defined targets. The best kind.
5) Sentiment is capitulation grade. NEAR is ranked #52 by market cap. Volume is thin. Social mentions are negligible. The crowd has forgotten about it entirely. That is not a reason to avoid it. That is the reason to buy it. The best entries in crypto always feel uncomfortable. If this felt easy, everyone would already be in. They are not.
What about the downside?
The support/resistance band at $1.05–$1.10 is the line in the sand. An 8-day close below $0.90 invalidates the double bottom structure and the thesis dies cleanly. Position size accordingly. This is not permission to be reckless.
Good luck,
Ww
================================================================
Disclaimer
This idea is for educational and informational purposes only. It is not financial advice. Trading cryptocurrencies involves substantial risk of loss and is not suitable for every investor. Always do your own research and consult a qualified financial adviser before making any investment decisions. Past performance is not indicative of future results
 Long
Long

 Long
Long