USDJPY - HTF Bullish**USDJPY — HTF Bullish**
Waiting for the intermediate/midterm liquidity sweep level to be taken to confirm this unclaimed high.
Once swept, waiting for either auction block reaction and reading the behavior from there.
Until then, patience.
Tracking remains the edge.
Let’s go . 🧃
Pivot Points
HTF 4H BullishPrice gave a midterm pullback, taking out multiple liquidity legs before failing near the bottom of the range origin zone and underneath the 50% equilibrium.
I took buys early last week as price showed HTF acceptance with strong momentum candles. Position was taken from the lower part of the range as price began showing that acceptance.
Since then, patience is key. Tracking remains the edge for me.
Now waiting on the minor pullback for continuation. Internal IDM has been taken, confirming the high. Watching for mitigation into the minor auction zone.
Let’s go. 🧃
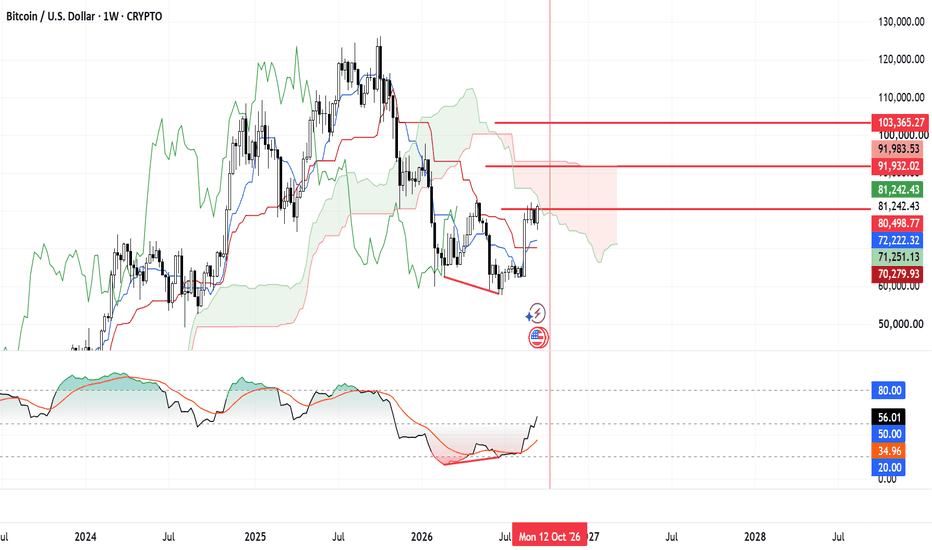
Bitcoin : What's next?CRYPTO:BTCUSD
With the bullish divergence being confirmed, it will most likely continue the run upwards. Break the current resistance at 80k and there is a possibility that it can reach 100k fast. Next major weekly pivot is 12 October. Invalidation is breaking the tenkan/kijun support which sits around 70-72k area.
EURUSD: Support & Resistance Analysis for Next Week 🇪🇺🇺🇸
Here is my latest structure analysis and important supports & resistances
for EURUSD for next week.
Consider these structures for pullback/breakout trading.
❤️Please, support my work with like, thank you!❤️
I am part of Trade Nation's Influencer program and receive a monthly fee for using their TradingView charts in my analysis.
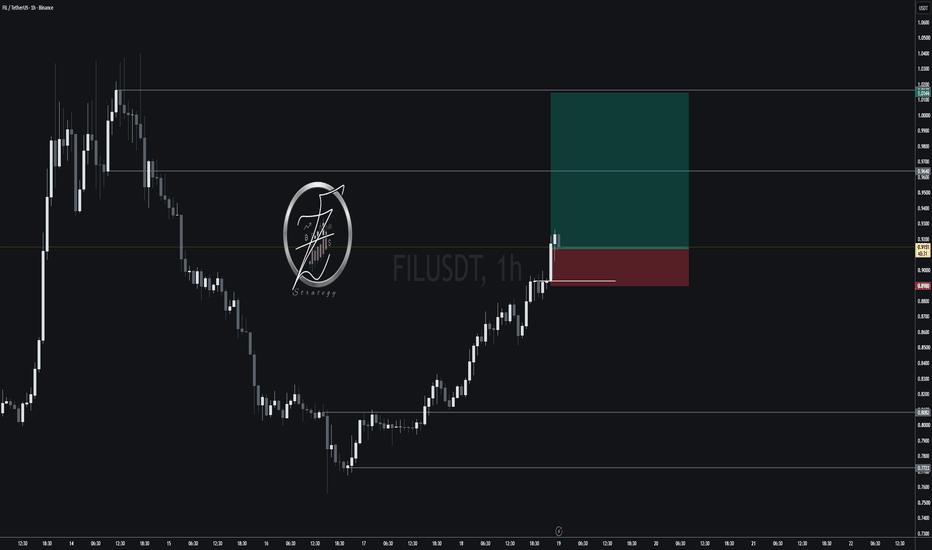
FILUSDT Analyses-40, September 19, 2026
Welcome to my page! I share daily technical analyses of crypto and other charts here.
BINANCE:FILUSDT
🔍 Market Structure Analysis:
FIL has shifted into a bullish 1H structure, with higher highs and higher lows forming after the 0.7723 bottom.
🎯 Entry & Exit Signal:
Buy Entry: 0.9138
Stop Loss: 0.8900
Targets: 0.9614 R/R:2 - 0.9640 - 1.0144
The buy signal is active. I usually secure most of the position around R:R 2, while the marked levels above represent the next important price zones.
Key Support & Resistance:
Key Resistance: 0.9640 / 1.0144
Key Support Area: 0.8900 / 0.8082 / 0.7723
⚠️Risk Management:
Maximum 1% risk per trade.
❤️Follow me for more: @EhsanZeydabadi
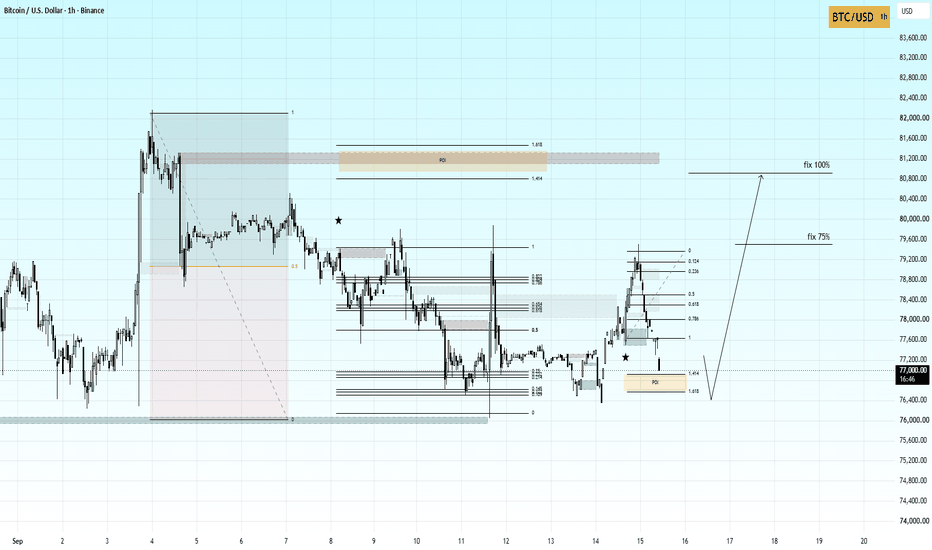
BTC/USD — From POI toward a 1.414 rebalance
Price has reached the marked area of interest on the lower timeframe. The decline formed a key imbalance that remains unbalanced.
I’m watching for a possible deeper move into the POI, followed by a reaction and an upside expansion. My main target is a rebalance toward the 1.414 external extension of the larger swing.
The levels for taking profit on 75% of the position and fully closing the trade are marked on the chart.
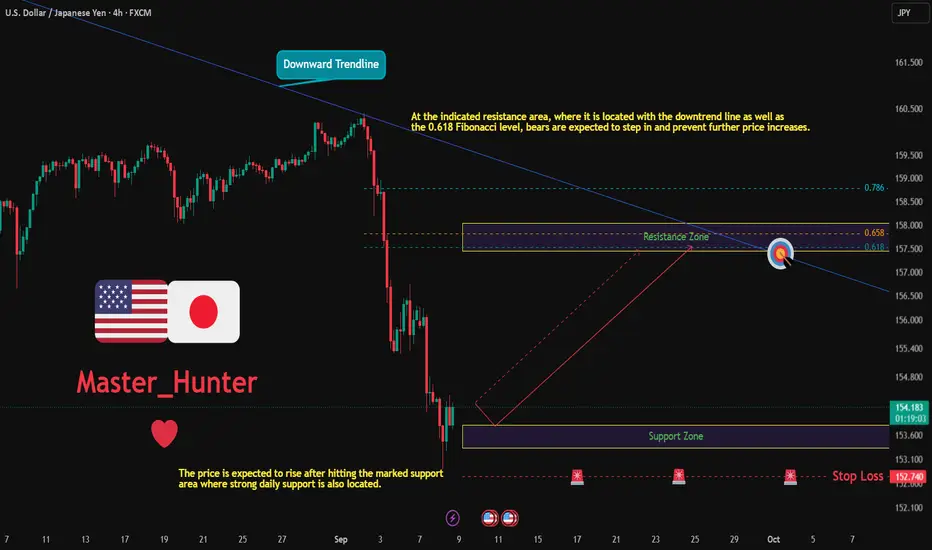
USDJPY: Bullish Push to 157.450?FX:USDJPY is eyeing a bullish rebound on the 4-hour chart , with price approaching a key support zone after recent decline, converging with a potential entry area that could ignite further upside momentum toward the higher resistance zone near the downward trendline and Fibonacci levels if buyers defend amid volatility. This setup suggests a solid rally opportunity with close to 1:3.5 risk-reward .🔥
Entry between 153.330–153.800 (entry from current price with proper risk management is recommended). Target at 157.450 . Set a stop loss at a daily close below 152.740 , yielding a risk-reward ratio of close to 1:3.5 . Monitor for confirmation via a bullish candle close above entry with rising volume.🌟
Fundamentally , USDJPY is trading around 154.20 in early September 2026.
For the US Dollar, the most important release this week (8–11 September) is the US Consumer Price Index (CPI) for August on Friday, September 11 — a key inflation report that can strongly influence Fed policy expectations.
For the Japanese Yen, a notable data point is the Japan Corporate Goods Price Index (CGPI) around mid-week, which provides insight into producer-level inflation pressures. 💡
📝 Trade Setup
🎯 Entry (Long):
153.330 – 153.800
(Entry from current price is acceptable with proper position sizing and strict risk management.)
🎯 Target:
157.450
❌ Stop Loss:
Daily close below 152.740
📈 Risk-to-Reward:
Close to 1:3.5
Will buyers defend 153.330–153.800 and push USDJPY toward 157.450, or will the support fail and invalidate the bullish rebound setup? 👇
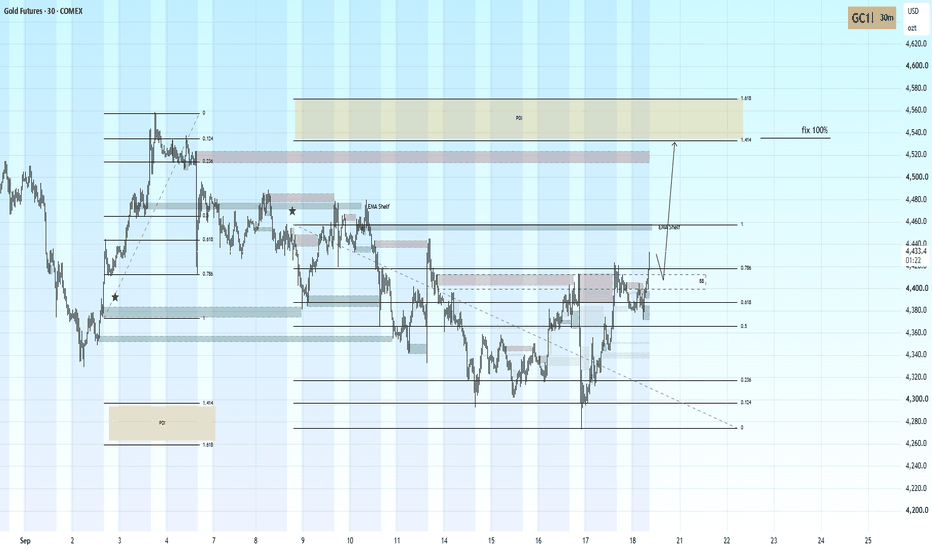
**Gold: External Expansion Toward 1.414**
After reaching our POI, Gold delivered the expected bullish reaction.
During the move toward the POI, the market formed a key imbalance. This area now remains the main zone to watch for a possible short-term rebalance and support.
The current structure indicates that the asset is developing an external expansion. A temporary pullback into the key imbalance is still possible and would remain consistent with the bullish scenario.
As long as this area holds, my main target is the Fibonacci **1.414 level**, located near **4535**. This is where I plan to take 100% of the profit.
A decisive loss of the key imbalance would require a reassessment of the scenario.
**We trust Fibonacci.**
This is my personal market view, not financial advice.
$BTC - Market Update (9/18)lows are holding here, and price just filled the half-wick into the 76k retest we highlighted yesterday
The daily and weekly rolling VWAPs are about to cross, which could give us some decent support here. Any retrace into 77k–76.5k is for adding.
Hold 77k here, then I’ll be looking for the poor highs at 80.3k as the initial target. Invalidation would be a clean break of 75.7kC update.
ONE/USDT 1D — Spot Accumulation Setup (+152% Potential)Historical key imbalances have a high probability of being fully rebalanced over time. ONE/USDT on the 1D timeframe presents a prime opportunity for spot accumulation as price consolidates at structural lows after leaving a major unfulfilled imbalance above.
Key Technical Factors:
High-Probability Imbalance Fill: The primary "Key imbalance" zone around 0.00204 remains open and acts as a major price magnet.
Spot Accumulation Advantage: Accumulating on spot at current structural lows eliminates leverage liquidation risk while targeting a massive macro expansion.
Fibonacci Confluence: The main imbalance aligns cleanly with the 1.0 Fib level. A full rebalance opens the path toward higher external targets (1.414 and 1.618 Fib extensions).
Trade Execution & Targets:
Accumulation Zone: Current price range (~0.00081)
Primary Target (100% Imbalance Fill): 0.00204 (+152% gain)
Macro Targets (DC / External Extensions): 1.414 & 1.618 Fib levels
NZDUSD: Bullish Push to 0.59300?FX:NZDUSD is eyeing a bullish rebound on the 4-hour chart , with price approaching a key support zone after recent decline, converging with a potential entry area that could ignite further upside momentum toward the higher resistance zone near the downward trendline if buyers defend amid volatility. This setup suggests a solid rally opportunity with more than 1:4 risk-reward .🔥
Entry between 0.57450–0.57600 (entry from current price with proper risk management is recommended). Target at 0.59300 . Set a stop loss at a daily close below 0.57200 , yielding a risk-reward ratio of more than 1:4 . Monitor for confirmation via a bullish candle close above entry with rising volume.🌟
Fundamentally , NZDUSD is trading around 0.578 in mid-September 2026.
For the New Zealand Dollar, the most important release this week (ending 18 September) is the New Zealand GDP q/q (Q2) around mid-week, which will provide key insight into economic growth.
For the US Dollar, the standout high-impact event is the FOMC Interest Rate Decision on Wednesday, September 16, along with the accompanying statement and press conference. 💡
📝 Trade Setup
🎯 Entry (Long):
0.57450–0.57600
(Entry from current price is acceptable with proper position sizing and strict risk management.)
🎯 Target:
0.59300
❌ Stop Loss:
Daily close below 0.57200
📈 Risk-to-Reward:
More than 1:4
Will buyers defend the 0.57450–0.57600 support zone and push NZDUSD toward 0.59300, or will the FOMC trigger a deeper breakdown? 👇
$ETH - Technical OutlookCRYPTOCAP:ETH got rejected from the 2540s and sold off into the 2400 area, where price has been consolidating and building a local range. We’ve since bounced back into 2430s, but still trading below the 2460 resistance.
2400 is the local support here and could see a bounce into 2460. But if price gets capped there, I think there’s a chance we test the lows in the 2350s. Anything below 2400 after that, then I’m looking for a sweep into 2300.
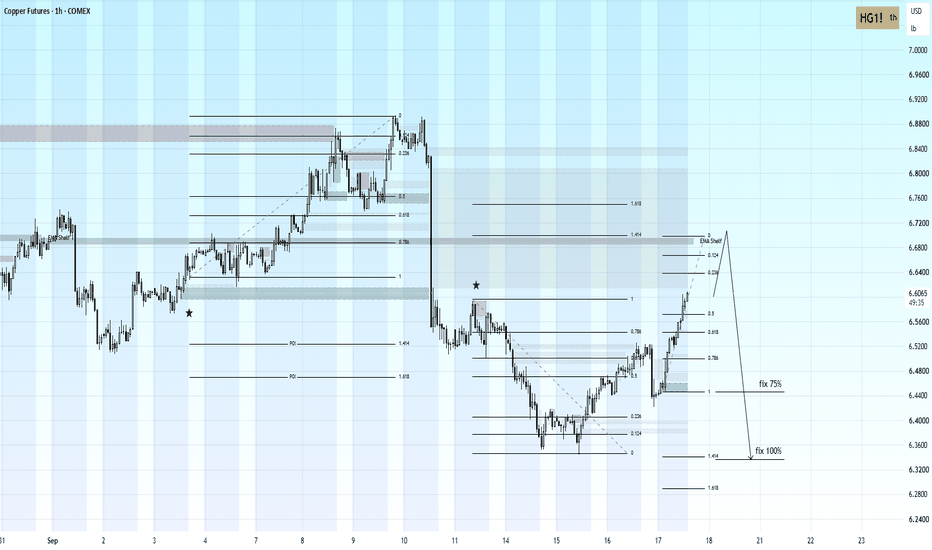
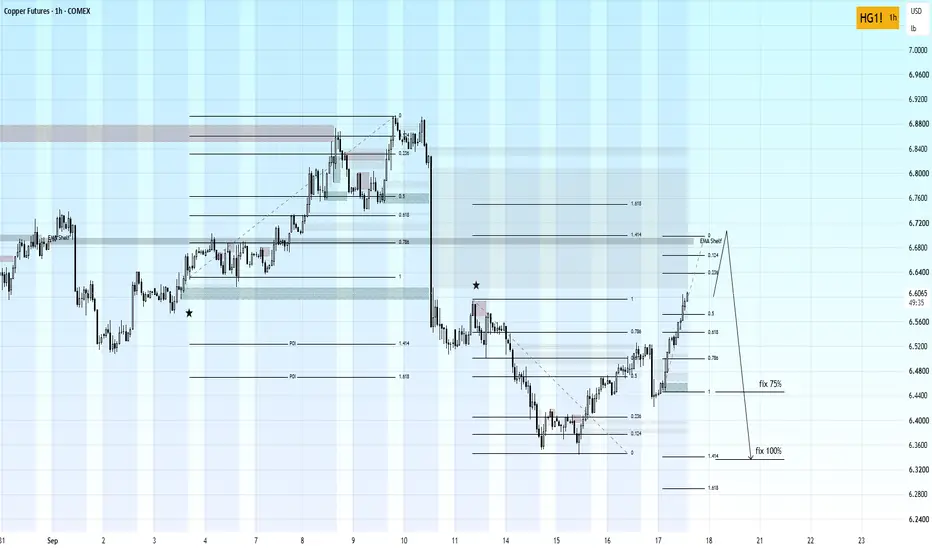
COPPER (HG) — REVERSAL SCENARIOCopper continues its bullish expansion toward the key Fibonacci POI between 1.414 and 1.618.
I expect price to first reach the 6.69–6.74 area, where I will be looking for confirmation of a bearish reaction and a potential reversal.
🎯 Targets after confirmation:
• Take 75% of the position near 6.45
• Close the remaining position near 6.34
I am not looking to enter short prematurely — the reaction inside the upper POI is essential. A confident consolidation above 1.618 would invalidate this bearish scenario.
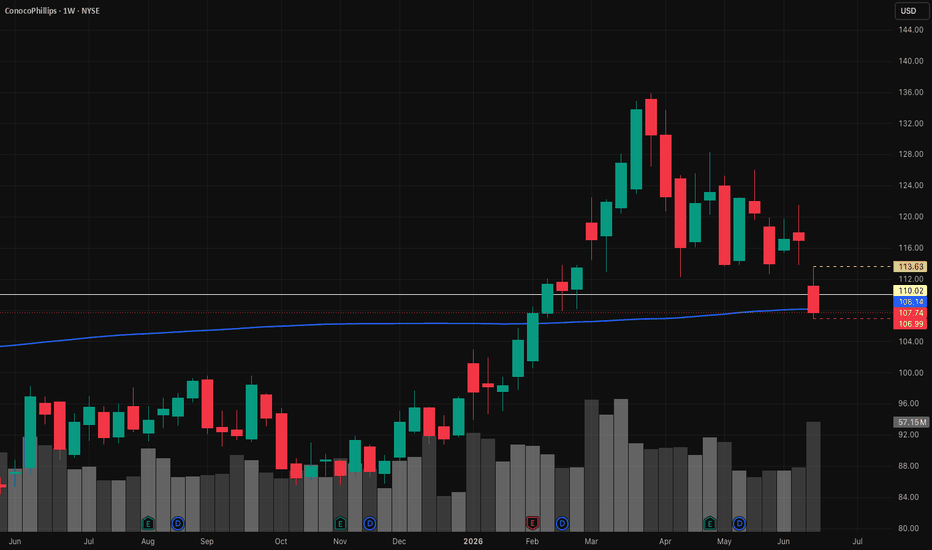
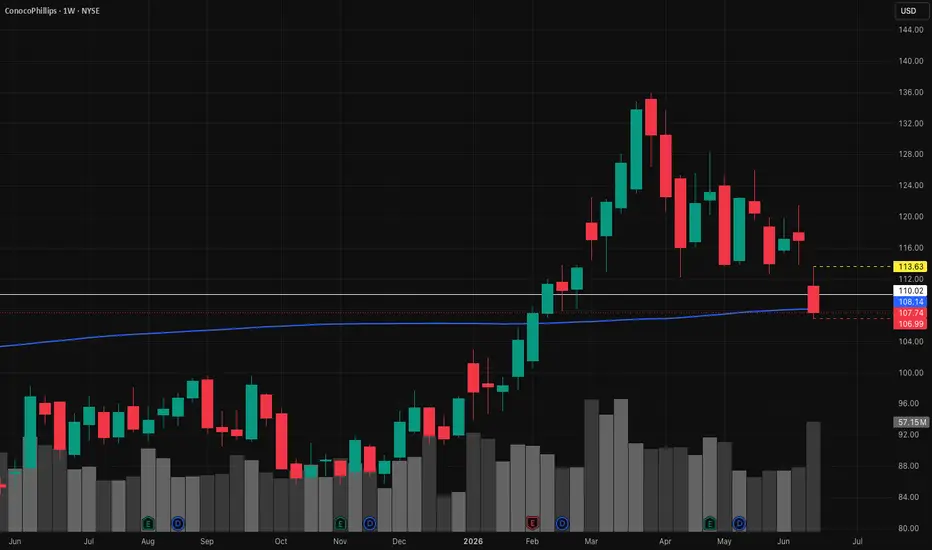
COP | June, 2026 | Continued stock growth- Timeframe: Weekly
- Trade type: Buy stop order
- Price: 113.63
- Take Profit: Open
- Stop Loss: 106.99 (-5.80 %)
Idea: Long on a breakout above last week's high - bullish momentum continuation.
Entry: Buy stop above last week’s high.
Stop-loss: Below the low of the same candle.
If the weekly candle closes below this level, the trade is invalidated.
Take Profit: Trailing stop following the lows of new weekly candles.
XAUUSD 15M: Supply Rejection & Short Continuation MappingOn the 15-minute timeframe, Gold (XAUUSD) has rejected the upper descending trendline and major overhead resistance area around the $4,330–$4,340 region. Following this rejection, price pulled back to retest a minor supply/flip zone near $4,314.81, setting up a potential short continuation scenario toward lower support areas.
Technical Reference Levels
Overhead Supply / Rejection Zone: ~$4,314.81 (Local Rejection Level / Resistance Block)
Invalidation / Structural Level: ~$4,324.86 (Above the immediate swing high)
Downside Target Level: ~$4,244.00 (Key lower demand block / target area)
Technical Setup Logic
Following a clean rejection at the higher descending trendline, price retraced into the resistance level at $4,314.81. The technical analysis maps out a potential short continuation out of this supply area, targeting the lower liquidity and demand zone near $4,244.00, with structural invalidation strictly placed above $4,324.86.
Disclaimer & Purpose
This post is strictly for educational, analytical, and charting practice purposes only. It is not a financial idea, trading signal, or investment advice. Always manage your own risk and perform independent research.
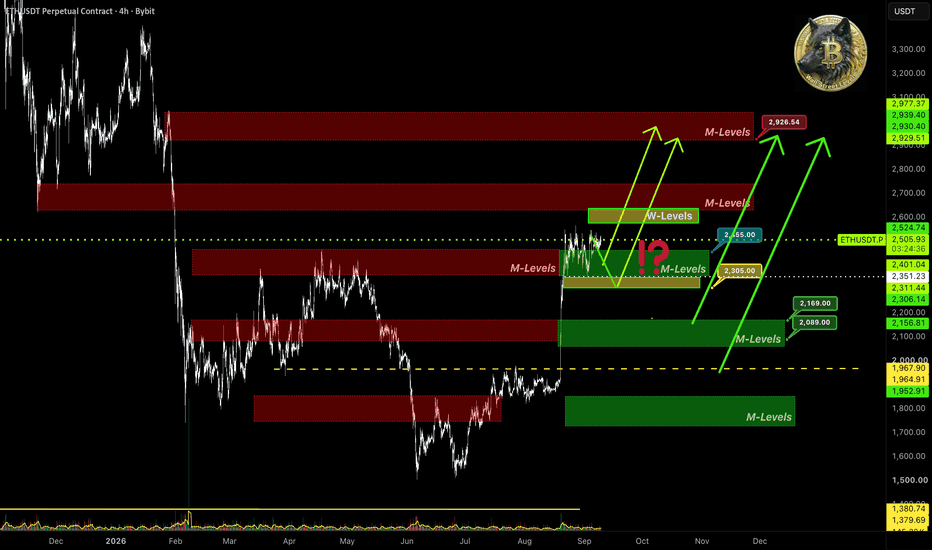
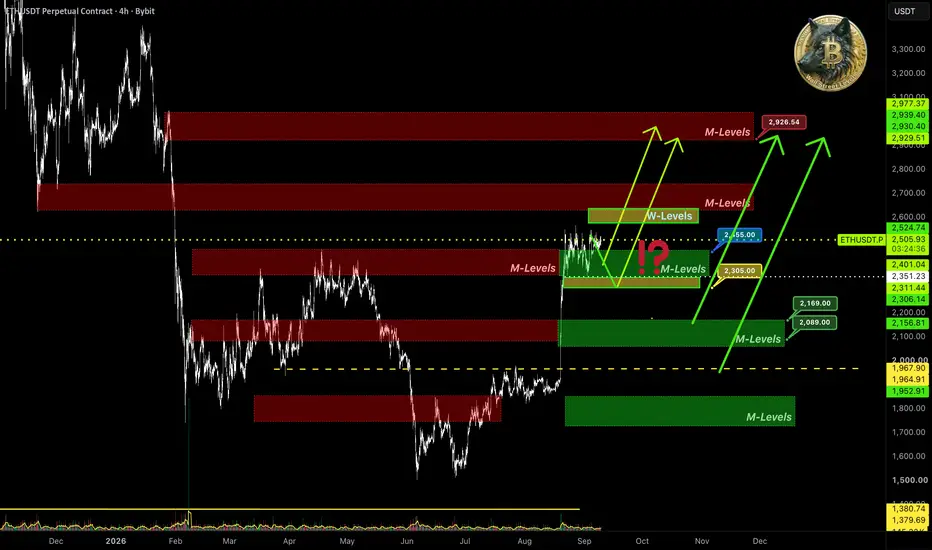
$ETH: Market Thoughts BYBIT:ETHUSDT.P
As seen on the chart, price has been trading at the monthly support 📊M-Levels $2368–$2442 for 2 weeks now, making no strong moves to break the level. But there's no real bounce with position building either. Just the flat market everyone hates.
🧩IMA data shows: the largest players have turned and are closing their long bets. Mid-sized players in the top 20 by position size are neutral — sitting on their hands and doing nothing. The previous institutional buying frenzy is gone. And the crowd, as always in these situations, jumped in at the highs and is waiting for the market to keep going up.
You could say capital is leaving the market, real buyers are scarce.
But during the US session, it's the opposite. While the broader market was selling and pulling money out, 🐋large players were buying a bit of the asset on this dip. It's not enough to move the market yet. We should watch the actions of institutions from US funds: if the buying continues, structurally we are already in a phase of stealth long accumulation.
The picture is mixed. The weekly bullish bias is weakening fast, but institutions are buying the dip during the US session.
What's the conclusion? Buyers are holding the lower boundary for now. But since 🐋large players are exiting positions quickly and the market overall is selling, there's downside risk. But calling a bearish flip is premature.
Trying to buy on the support test right now comes with the risk of a market flush.
For a real rally, we need to see large players' interest return to the spot market. Right now, speculators dominate, and we might just see price chop inside the weekly consolidation range 📊W-Levels $2440–$2560.
⚠️If the idea was useful — glad to have your support 🚀.
Analysis based on 🧩IMA (Integrated Market Analysis)
📊M-Levels — Institutional Interest Level (IIL)