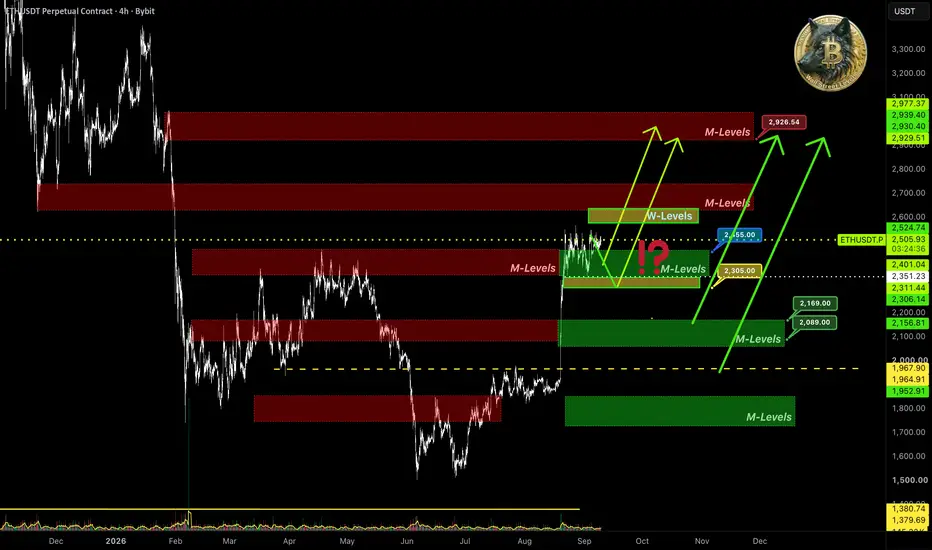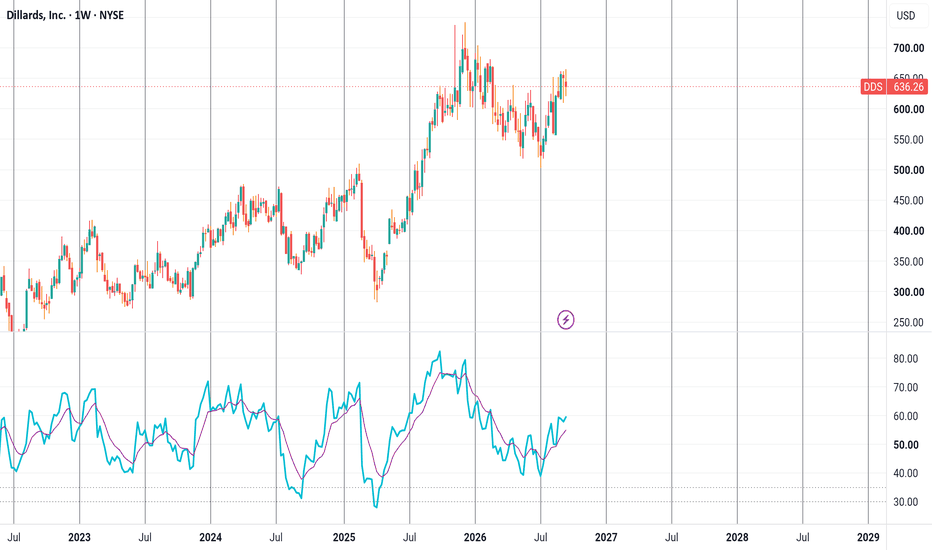
AMS | The time to go long has come- Timeframe: Weekly
- Trade type: Buy stop order
- Price: 50.96
- Take Profit: Open
- Stop Loss: 48.54 (-4.80 %)
Idea: Long on a breakout above last week's high - bullish momentum continuation.
Entry: Buy stop above last week’s high.
Stop-loss: Below the low of the same candle.
If the weekly candle closes below this level, the trade is invalidated.
Take Profit: Trailing stop following the lows of new weekly candles.
Pivot Points
XLI | Continued growth ETF- Timeframe: Weekly
- Trade type: Buy stop order
- Price: 182.51
- Take Profit: Open
- Stop Loss: 177.60 (-2.70 %)
Idea: Long on a breakout above last week's high - bullish momentum continuation.
Entry: Buy stop above last week’s high.
Stop-loss: Below the low of the same candle.
If the weekly candle closes below this level, the trade is invalidated.
Take Profit: Trailing stop following the lows of new weekly candles.
TMUS | Continued stock growth- Timeframe: Weekly
- Trade type: Buy stop order
- Price: 198.86
- Take Profit: Open
- Stop Loss: 186.21 (-6.40 %)
Idea: Long on a breakout above last week's high - bullish momentum continuation.
Entry: Buy stop above last week’s high.
Stop-loss: Below the low of the same candle.
If the weekly candle closes below this level, the trade is invalidated.
Take Profit: Trailing stop following the lows of new weekly candles.
V | May, 2026 | Continued stock growth- Timeframe: Weekly
- Trade type: Buy stop order
- Price: 331.67
- Take Profit: Open
- Stop Loss: 320.90 (-3.30 %)
Idea: Long on a breakout above last week's high — bullish momentum continuation.
Entry: Buy stop above last week’s high.
Stop-loss: Below the low of the same candle.
If the weekly candle closes below this level, the trade is invalidated.
Take Profit: Trailing stop following the lows of new weekly candles.
👉 Pionex | 200+ U.S. stock tokens | xStocks
Feel free to like and share your thoughts in the comments! ❤️
Nifty Analysis EOD – 23 July 2026 – Thursday🟢 Nifty Analysis EOD – 23 July 2026 – Thursday 🔴
Band’s Edge: Tests the 23,815 Floor Twice Before Settling at 23,872
🗞 Nifty Summary
Nifty opened with a gap down of 83 points, finding its footing near the key support zone of 23,900. After the opening tick, the index dropped another 31 points before finding a base and gradually climbing towards gap filling. Around 11:00 AM, that gap-filling process completed — and that’s when things got interesting. Constant selling pressure at the day high dragged Nifty nearly 180 points below the IBL, marking a new day low at the support level of 23,815. A recovery of about 80 points followed, but from the IBL again, selling pressure pushed sharply below the day low. The same 23,815 level came to the rescue once more, and another 82-point recovery brought the index to close the day at 23,872.20, with an adjusted close of 23,869.60.
What’s notable is that Nifty tested the bottom of the band created by the 8th July candle — which means we’re still technically inside this range. But it’s looking increasingly fragile. As I write this, Gift Nifty is showing around 140 points down and Brent Crude is up 1.5% from our market close. Another gap down seems likely — we’ll see where we open tomorrow.
The day closed with a bearish candle sitting right at a crucial stage — the real question is whether Nifty can sustain above 23,825 or whether the gap below gets filled. That answer comes tomorrow. One thing I'm keeping in mind though: we're under geopolitical tension right now, and most of what we're seeing on the chart is being driven by news and fear rather than clean technicals. So I don't want to build a bias here — I'll try to stay with the flow, not against it.
🛡 5 Min Intraday Chart with Levels
📉 Daily Time Frame Chart with Intraday Levels
🕯 Daily Candle Breakdown
Open: 23,904.80
High: 23,990.75
Low: 23,807.20
Close: 23,869.60
Change: −126.65 (−0.53%)
🏗️ Structure Breakdown
Type: Bearish candle with recovery wicks — sellers in control but support held twice
Range: ≈ 183 points — moderate volatility
Body: ≈ 35 points — light body reflecting tug-of-war between sellers and buyers near close
Upper Wick: ≈ 86 points — supply stepped in early; the day high didn’t hold long
Lower Wick: ≈ 62 points — demand showed up at 23,815 not once but twice
🛡 5 Min Intraday Chart
⚔️ Gladiator Strategy Update
ATR: 224.19
IB Range: 88.75 → Medium
Market Structure: ImBalanced
Trade Highlights:
09:45 Long Trade: Target Hit (R:R 1:1.68)
11:11 Short Trade: Target Hit (R:R 1:5.44)
Trade Summary: Both trades hit their targets — clean execution, good R:R on the short especially. After two solid wins, I didn't want to give back the gains, so I closed the day early and ignored the further signals the system gave. Sometimes protecting what you've made is the right call.
🧱 Support & Resistance Levels
Resistance Zones: 23,920 | 23,975 | 24,030 | 24,100
Support Zones: 23,835 ~ 23,785 | 23,630
🧠 Final Thoughts
“When the news writes the chart, fighting the tape is just expensive stubbornness.”
Nifty defended 23,815 twice today, and that’s worth noting. Both times the index was pushed below the IBL and both times buyers showed up at the same spot. That kind of double-test at a level usually means something — either it’s strong enough to matter, or the third visit breaks it for good.
Looking at tomorrow, the 23,835 ~ 23,785 zone is the immediate cushion. If that holds through the open, there may be a case for stabilisation. But if Gift Nifty’s 140-point gap down signal plays out, we might open right below that zone — and then the next meaningful support sits further down at 23,630. Resistance up at 23,920 and 23,975 will be the first walls to watch if any recovery attempt happens.
I’ll wait to see how we open before forming any view. A gap-down open into support is not the same as a breakdown — but it’s not something to step in front of without confirmation either. Patience before position tomorrow.
✏️ Disclaimer
This is my personal digital diary and represents my own analysis and point of view. It is not financial advice; please consult a professional advisor before making any trading decisions.
PKX | The time to go long has come- Timeframe: Weekly
- Trade type: Buy stop order
- Price: 53.47
- Take Profit: Open
- Stop Loss: 49.91 (-6.50 %)
Idea: Long on a breakout above last week's high - bullish momentum continuation.
Entry: Buy stop above last week’s high.
Stop-loss: Below the low of the same candle.
If the weekly candle closes below this level, the trade is invalidated.
Take Profit: Trailing stop following the lows of new weekly candles.
CE | The time to go long has come- Timeframe: Weekly
- Trade type: Buy stop order
- Price: 48.94
- Take Profit: Open
- Stop Loss: 45.22 (-7.60 %)
Idea: Long on a breakout above last week's high - bullish momentum continuation.
Entry: Buy stop above last week’s high.
Stop-loss: Below the low of the same candle.
If the weekly candle closes below this level, the trade is invalidated.
Take Profit: Trailing stop following the lows of new weekly candles.
AMZN | Continued stock growth- Timeframe: Weekly
- Trade type: Buy stop order
- Price: 242.42
- Take Profit: Open
- Stop Loss: 225.55 (-7.00 %)
Idea: Long on a breakout above last week's high - bullish momentum continuation.
Entry: Buy stop above last week’s high.
Stop-loss: Below the low of the same candle.
If the weekly candle closes below this level, the trade is invalidated.
Take Profit: Trailing stop following the lows of new weekly candles.
BTC/USD Bullish Setup – Buying the Order Block Disclaimer:
This is not financial advice. This idea is shared for educational purposes only. Always do your own research and trade at your own risk.
Analysis:
Bitcoin is currently showing a bullish market structure with higher highs and higher lows. We have a clear Bullish Order Block (OB) in the 64,000 – 64,300 zone. Price is expected to sweep the Sell Side Liquidity around 65,000 before reversing and bouncing strongly from our demand zone.
Entry Plan: Buy Zone: 64,000 – 64,300
Reason: Bullish Order Block + Strong Market Structure
Target 1: 65,000 (Liquidity Grab)
Target 2: 66,000 – 66,500
Invalidation: Break and close below 63,500
This setup offers a high-probability long opportunity if price reaches the bullish OB and shows reversal confirmation.
#Bitcoin #BTC #BTCUSD #Crypto #CryptoTrading #OrderBlock #BullishSetup #BitcoinAnalysis
TEL | Continued stock growth- Timeframe: Weekly
- Trade type: Buy stop order
- Price: 204.30
- Take Profit: Open
- Stop Loss: 196.87 (-3.60 %)
Idea: Long on a breakout above last week's high - bullish momentum continuation.
Entry: Buy stop above last week’s high.
Stop-loss: Below the low of the same candle.
If the weekly candle closes below this level, the trade is invalidated.
Take Profit: Trailing stop following the lows of new weekly candles.
Nifty Analysis EOD – 21 July, 2026 – Tuesday🟢 Nifty Analysis EOD – 21 July, 2026 – Tuesday 🔴
Defended, Not Decided: Bulls Hold 23,975 but Bears Drive the Close
🗞 Nifty Summary
Nifty opened with a 48-point gap down on negative sentiment driven by geopolitical tensions. From the day’s high, it dropped sharply — a 157-point fall — where the 24,000 level tried to hold. After a 43-point recovery attempt, the index slipped again and tested the 23,975 support zone. That level held for the rest of the session like a strong floor, and from around 12:45 PM, the market settled into a tight 50-point range. The session ended in the middle of that range at 23,991.05, with an adjusted close of 23,996.25 — just below the psychological level of 24,000.
Today’s close is below the previous seven sessions’ closes and confirms a fakeout of the 17th July breakout zone. Bulls still have a base in the 23,975 ~ 24,030 zone, but today it looks like that grip is weakening — bears seem to be in the driver’s seat now. The daily candle is a bearish body with a modest lower wick, suggesting some demand did show up near 23,975 but wasn’t strong enough to push back meaningfully. Tomorrow is the key session — if today’s low holds, bulls get a chance to reset; if not, 23,900 and 23,785 may come into view.
🛡 5 Min Intraday Chart with Levels
📉 Daily Time Frame Chart with Intraday Levels
🕯 Daily Candle Breakdown
Open: 24,150.45
High: 24,166.30
Low: 23,961.40
Close: 23,996.25
Change: −191.45 (−0.79%)
🏗️ Structure Breakdown
Type: Bearish candle — sellers dominated the session from the open with limited recovery
Range: ≈ 205 points — moderate volatility
Body: ≈ 154 points — steady selling pressure through the session
Upper Wick: ≈ 16 points — barely any buying above the open, supply appeared almost immediately
Lower Wick: ≈ 35 points — some demand did step in near the lows, but not with enough force to matter
🛡 5 Min Intraday Chart
⚔️ Gladiator Strategy Update
ATR: 228.09
IB Range: 157.60 → Medium
Market Structure: ImBalanced
Trade Highlights:
10:23 Short Trade: Trailing SL Hit
11:53 Short Trade: Target Hit (R:R 1:3.81)
12:58 Short Trade: SL Hit
13:58 Short Trade: SL Hit
Trade Summary: The day had four short trades — one target hit, one trailing SL, and two SL hits. The 11:53 trade did the work, closing at a solid 1:3.81 R:R, but the afternoon gave back some ground. The two SL hits in the second half were clean exits — the system did what it was supposed to, even if the outcome wasn’t in our favour. Two out of four is not the day I wanted, but the process held. Tomorrow I’ll come in fresh and let the levels do the talking.
🧱 Support & Resistance Levels
Resistance Zones: 24,260 | 24,300 | 24,360 ~ 24,380 | 24,430 | 24,460
Support Zones: 24,200 ~ 24,160 | 24,100 | 24,030
🧠 Final Thoughts
“The floor held today, but the market doesn't hand out ownership for just showing up.”
The notable thing today was how 23,975 held through the afternoon. The index tested it, sat on it, and refused to break — but equally refused to bounce with any real intent. That kind of price action where a level holds but buying doesn’t follow is worth watching. It’s not a sign of strength; it’s more like the bears pausing before the next move.
For tomorrow, 23,975 ~ 24,030 is the zone that matters. If the index opens above and defends it, bulls might get a chance to stabilise and push toward 24,100. If that floor gives way, 23,900 becomes the next meaningful area to watch, and below that 23,785 is on the map.
I’ll keep the bias short until the structure says otherwise. No need to overthink it — the market has been fairly clear about direction today, and tomorrow I just need to follow what the levels show me, not what I want to see.
✏️ Disclaimer
This is my personal digital diary and represents my own analysis and point of view. It is not financial advice; please consult a professional advisor before making any trading decisions.
DOLE | The time to go long has come- Timeframe: Weekly
- Trade type: Buy stop order
- Price: 14.13
- Take Profit: Open
- Stop Loss: 13.57 (-4.00 %)
Idea: Long on a breakout above last week's high - bullish momentum continuation.
Entry: Buy stop above last week’s high.
Stop-loss: Below the low of the same candle.
If the weekly candle closes below this level, the trade is invalidated.
Take Profit: Trailing stop following the lows of new weekly candles.
Nifty Analysis EOD – 21 July, 2026 – Tuesday🟢 Nifty Analysis EOD – 21 July, 2026 – Tuesday 🔴
Compression Continued: Inside the Inside: Silent Expiry
🗞 Nifty Summary
Nifty opened flat to negative and made a brief attempt to test the PDH, but 24,260 acted as strong resistance and pushed price back down. The index then slowly and steadily breached the IBL and moved to the 24,160 support zone. From there, the rest of the session was spent within a tight 24,190 ~ 24,160 band — just a 30-point range.
There was one attempt to break below this range, but the PDL held as strong support and a sharp recovery brought price back to the upper band. After 3:00 PM, the range compressed further to just 16 points, and the session ended quietly at 24,193.95 with no real displacement in either direction.
Today’s weekly expiry closed very silently — no struggle, no drama. On the daily time frame, we’re still inside the previous day’s range, which is itself inside the prior bar. That’s deep contraction. A breakout on either side is needed before an expansion play can develop.
🛡 5 Min Intraday Chart with Levels
📉 Daily Time Frame Chart with Intraday Levels
🕯 Daily Candle Breakdown
Open: 24,216.05
High: 24,262.20
Low: 24,135.65
Close: 24,187.70
Change: −50.80 (−0.21%)
🏗️ Structure Breakdown
Type: Bearish Spinning Top — price drifted lower but neither side committed
Range: ≈ 127 points — low volatility
Body: ≈ 28 points — minimal seller pressure, no real follow-through
Upper Wick: ≈ 46 points — mild supply rejection at the open area
Lower Wick: ≈ 52 points — buyers defended the lows but lacked energy to reclaim
🛡 5 Min Intraday Chart
⚔️ Gladiator Strategy Update
ATR: 239.60
IB Range: 112.45 → Medium
Market Structure: Balanced
Trade Highlights:
09:53 Long Trade: SL Hit
10:22 Short Trade: Trailing SL Hit (small loss)
11:43 Short Trade: SL Hit
12:58 Short Trade: SL Hit
Trade Summary: Four trades today and all four closed in the red — three clean SL hits and one trailing SL that still ended with a small loss. On a day this compressed, the system kept finding setups that the market simply refused to follow through on. It happens. The structure was balanced, the range was tight, and that combination doesn’t always play well with momentum entries. Nothing to force-correct here — this was the market’s day, not mine.
🧱 Support & Resistance Levels
Resistance Zones: 24,260 | 24,300 | 24,360 ~ 24,380 | 24,430 | 24,460
Support Zones: 24,200 ~ 24,160 | 24,100 | 24,030
🧠 Final Thoughts
“When the market stops talking, stop trying to finish its sentences.”
Today was a reminder that not every session hands you something clear. The index spent most of the day in a 30-point box — and on a weekly expiry day, that silence is its own kind of message. Four SL hits across four trades says less about the setups and more about the conditions. Balanced structure, compressed range, no expansion — the Gladiator system was looking for a move that the market had already decided not to make.
Looking into tomorrow, the key zone to watch is 24,200 ~ 24,160 on the support side. If that holds and price starts pushing above 24,260, there’s a case for an expansion attempt toward 24,300 and beyond. A clean break below 24,160, on the other hand, opens the door toward 24,100 and possibly 24,030. The inside-bar-within-inside-bar structure on the daily means whichever side breaks first, it could move with some energy.
Four reds in a row can feel heavy at the end of the day. But forcing trades into a market that’s made up its mind to do nothing is a different kind of mistake. Tomorrow I come in fresh, watch the levels, and let the price show me something before I act.
✏️ Disclaimer
This is my personal digital diary and represents my own analysis and point of view. It is not financial advice; please consult a professional advisor before making any trading decisions.
As $USO goes $CVX $XOM will followAMEX:USO is currently making a v-shape recovery back to it's previous highs. Unsure if it will return there but this is my idea.
If AMEX:USO can get above the 61.8% on the fib around $134, I would say yes. Have you missed the entire move? No as it still will track back towards $150 before it will hit a bit of exhaustion, before another decision in the market is made.
Trade ideas NYSE:CVX NYSE:XOM
BTC Analyses-10, [July 21, 2026]Welcome to my page! I share daily technical analyses of Bitcoin and other charts here.
BINANCE:BTCUSDT
💡Market Analysis:
Bitcoin is currently testing the critical H-4 resistance level at 65,470 after a strong upward push. We are waiting for a decisive breakout candle with >80% body closing above this zone or a confirmed pullback to execute our next trade setup.
Key Support & Resistance:
Key Resistance: 65,470.00
Key Support Area: 64,387.99
🎯 Trade Entry & Exit Plan:
Entry : Breakout/Pullback of trendline or key zones with >50% candle body.
Stop Loss : Behind the last wave or the last breakout candle.
Take Profit : Minimum R:R 2, with further targets at major horizontal levels.
⚠️Risk Management:
Maximum 1% risk per trade.
❤️Please share your thoughts and comments on this analysis!
TSN | The time to go long has come- Timeframe: Weekly
- Trade type: Buy stop order
- Price: 59.11
- Take Profit: Open
- Stop Loss: 56.44 (-4.50 %)
Idea: Long on a breakout above last week's high - bullish momentum continuation.
Entry: Buy stop above last week’s high.
Stop-loss: Below the low of the same candle.
If the weekly candle closes below this level, the trade is invalidated.
Take Profit: Trailing stop following the lows of new weekly candles.
HON | Continued stock growth- Timeframe: Weekly
- Trade type: Buy stop order
- Price: 230.47
- Take Profit: Open
- Stop Loss: 220.39 (-4.40 %)
Idea: Long on a breakout above last week's high - bullish momentum continuation.
Entry: Buy stop above last week’s high.
Stop-loss: Below the low of the same candle.
If the weekly candle closes below this level, the trade is invalidated.
Take Profit: Trailing stop following the lows of new weekly candles.
HLong
$SOL Sitting on a Low-Volume Pocket. Watching for the SweepWatching CRYPTOCAP:SOL and I'd like to see this scenario play out. There's a local liquidity zone with no volume in it. Price clearly won't linger there, so we've got two options here.
Price flies through that low volume zone off this liquidity and holds above (no trade).
Liquidity grab and a return to the zone near 0.5.
The second scenario is the one that gives me a chance to enter a position. Watching closely, I'll be looking for a break on the lower timeframe in case of a sweep and absorption, and opening the trade if the conditions are there.
NFA!
NZDCHF: Overbought Market & Pullback 🇳🇿🇨🇭
NZDCHF will likely retrace from a key historical resistance level.
A bearish choch on an hourly time frame provides a strong confirmation
of the overbought state of the market.
Goal - 0.4739
❤️Please, support my work with like, thank you!❤️
I am part of Trade Nation's Influencer program and receive a monthly fee for using their TradingView charts in my analysis.
VITL | The time to go long has come- Timeframe: Weekly
- Trade type: Buy stop order
- Price: 13.89
- Take Profit: Open
- Stop Loss: 12.41 (-10.60 %)
Idea: Long on a breakout above last week's high - bullish momentum continuation.
Entry: Buy stop above last week’s high.
Stop-loss: Below the low of the same candle.
If the weekly candle closes below this level, the trade is invalidated.
Take Profit: Trailing stop following the lows of new weekly candles.
JVA | The time to go long has come- Timeframe: Weekly
- Trade type: Buy stop order
- Price: 3.49
- Take Profit: Open
- Stop Loss: 3.29 (-5.70 %)
Idea: Long on a breakout above last week's high - bullish momentum continuation.
Entry: Buy stop above last week’s high.
Stop-loss: Below the low of the same candle.
If the weekly candle closes below this level, the trade is invalidated.
Take Profit: Trailing stop following the lows of new weekly candles.