Arbitrum News: Launch of Mentorship Program with RobinhoodRobinhood, aimed at supporting innovative teams on Arbitrum One and Robinhood Chain. This initiative allows teams to connect with investors and ecosystem partners, pitch at a Demo Day, and compete for a total of $100K in prizes. Such programs can significantly enhance funding opportunities and community engagement in the blockchain space.
Breaking It Down
In a notable move, Arbitrum is expanding its commitment to innovation with the launch of its Mentorship Program alongside Robinhood. This ini
Rectangle
Gold XAUUSD — Rising Channel Breakdown Could Lead to 4,081 DemGold is testing the lower boundary of its ascending channel after facing rejection near the 4,190–4,200 resistance zone on the 1-hour chart.
The key question is whether buyers can defend channel support or sellers will force a structural breakdown.
Technical Observation
The recent recovery has lost momentum near resistance. A confirmed hourly close below the channel, followed by a failed retest, could shift short-term momentum in favor of sellers.
Key Levels
Resistance: 4,190–4,200
Interme
GBPUSD Daily — Can Buyers Reclaim the Descending TrendlineGBPUSD is showing a recovery after finding support around the 1.3200–1.3260 region. The latest bullish move has pushed price back above the marked key level near 1.3260, suggesting that buyers are attempting to regain short-term momentum.
However, the broader descending structure has not yet been fully invalidated. The resistance zone around 1.3530–1.3570 remains a significant barrier.
Key Technical Levels
Current Price: 1.3327
Key Support: 1.3250–1.3260
Resistance Zone: 1.3530–1.3570
Pote
USDJPY: Bullish Continuation 🇺🇸🇯🇵
USDJPY broke the resistance of the horizontal range on a 4H time frame.
We see its retest at the moment.
I expect a bullish continuation to 158.75 level.
❤️Please, support my work with like, thank you!❤️
I am part of Trade Nation's Influencer program and receive a monthly fee for using their TradingView charts in my analysis.
BTC: Bears Got Their $80K Target — Is $76K Next?Hey traders! 🌴☀️
❗️In my last post, when price repeatedly failed to move away from $82.5K toward $84K, I pointed out that the bounce looked weak and warned:
“The longer BTC remains around current levels, the higher the probability of a breakdown below $82.5K becomes. Bitcoin needs to reclaim $84K decisively and move back above the midpoint of the trading range as soon as possible.”
Unfortunately for the bulls, exactly what I warned about happened. Price failed to deliver the much-needed boun
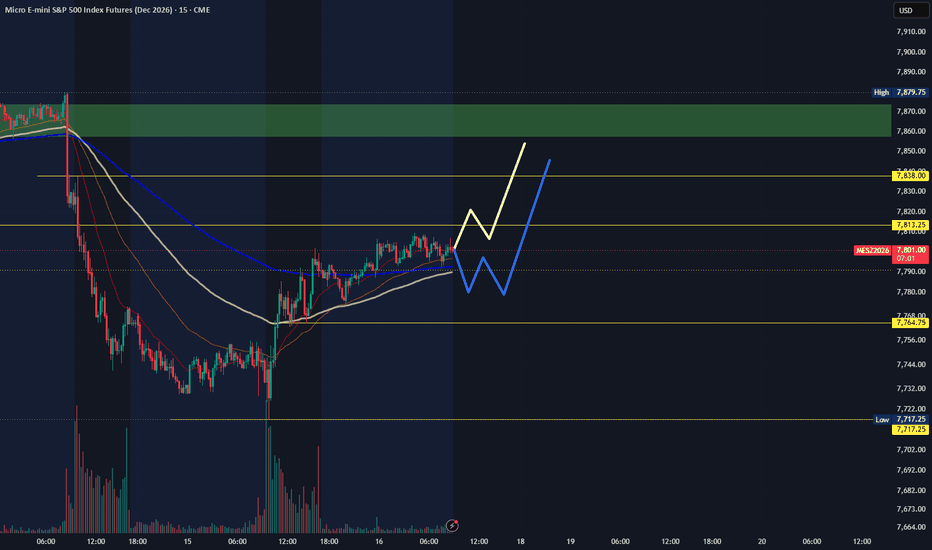
MESZ Oct 16: Can Buyers Hold 7764 and Push Toward 7813–7838?MESZ has bounced strongly from yesterday’s lows and is now trading around 7,800.
My short-term bias remains bullish, but 7,764 is the key level I want buyers to defend.
If price remains above that area and bullish confirmation develops, the first upside target is the fair value gap around 7,813.
Above that, the next important target is approximately 7,837–7,838, followed by the larger order-block zone highlighted above price.
A confirmed 15-minute close below 7,764 would weaken my bullish intrad
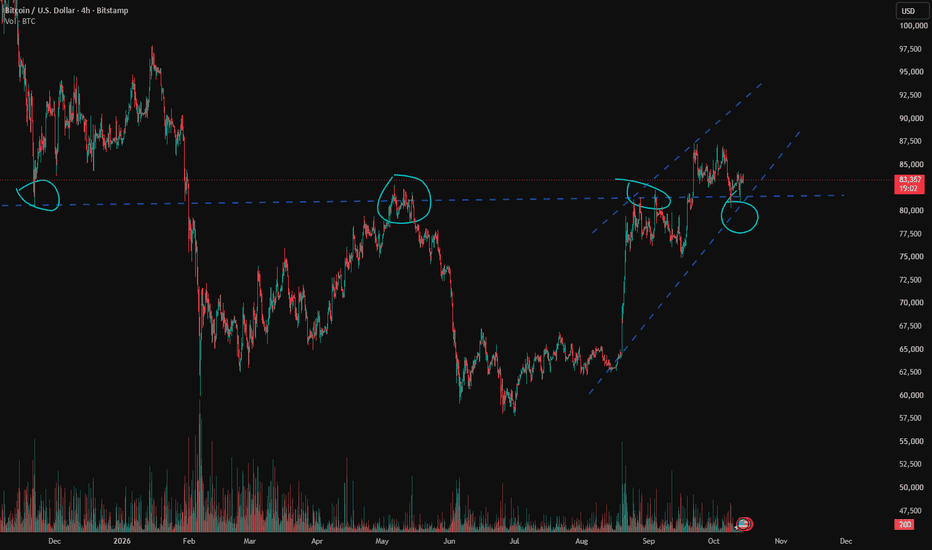
The key to trading is understanding the market direction.Looking at the current market structure for Bitcoin 📈, there is potential for a continued short-term rise, with the possibility of testing the $90,000–$100,000 range.
Traders who went long at high levels are about to see their positions turn profitable. If you are a long-term trader, be sure not to close your positions at current levels.
For short-term traders, consider two scenarios: a rise followed by a drop, or a drop followed by a rise. If the price dips below $80,000 first, you can increa
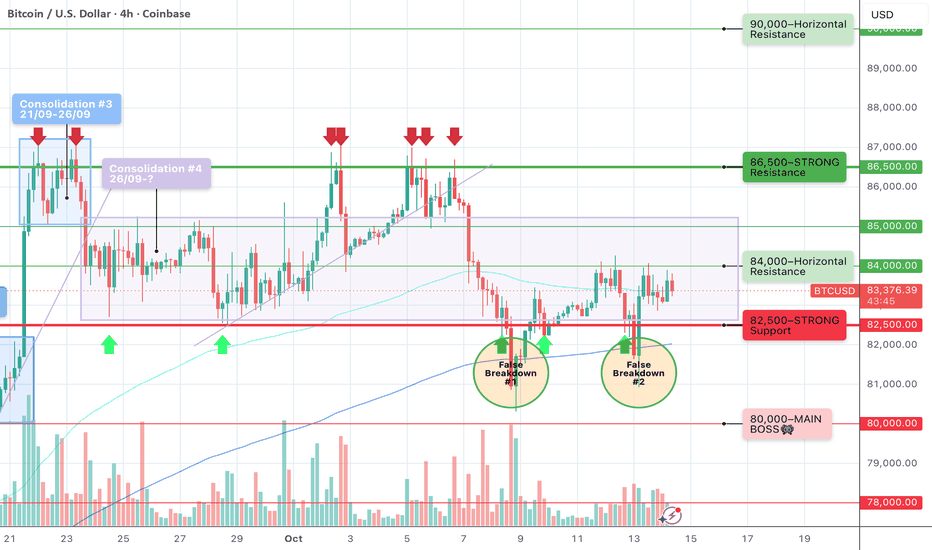
BTC: Bulls Are Losing Strength Near Range LowsHey friends! ☀️
The situation hasn’t changed much since my last update. Over the past 24 hours, we’ve seen another false breakdown (#2) below $82.5K and a bounce off the 4H EMA 200.
The moving average has already acted as solid support twice, reversing price after false breakdowns. So let’s not count it out just yet if the bears make another attempt to push the price lower.
What’s happening on the chart right now? 👁️
Formally, BTC continues to trade within the $82.5K–$86.5K range. However, i
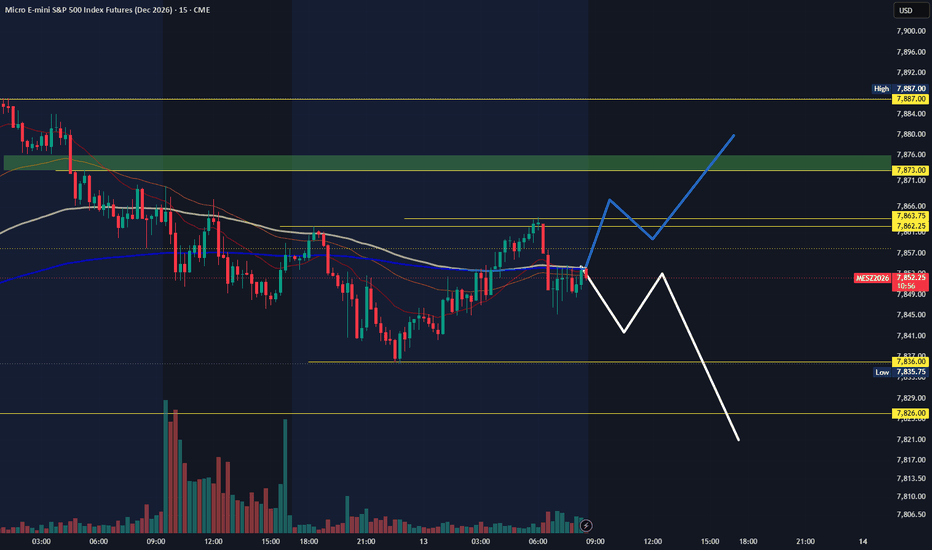
MESZ Oct 13: 15M Bullish Toward 7873, But 4H Still Range-BoundMESZ remains inside a higher-time-frame range between approximately 7,826 and 7,887.
Because price is still inside that range, I’m keeping the broader bias neutral until we get a confirmed breakout.
On the 1-hour chart, downside liquidity sits around 7,836, while the first upside liquidity is around 7,863.
Above that, the next important target is the 1-hour fair value gap around 7,873.
The 15-minute chart has already produced a close above approximately 7,862, giving an early bullish signal on t
My Analysis of PYTH Across the Daily Timeframe and the Key Upcom## PYTH Analysis — Daily Timeframe (1D)
Based on the chart provided, PYTH is trading within several price ranges. A breakout from each range could open the way toward the next range.
**Current price:** $0.0836 USDT
### Key Price Ranges and Potential Targets
| Price Range | Potential Target After Breakout |
|---|---:|
| $0.08 – $0.10 | $0.15 |
| $0.10 – $0.15 | $0.23 |
| $0.23 – $0.41 | $0.55 |
| $0.55 – $0.70 | $0.70 and above |
### Bullish Scenario
If PYTH holds above the $0.08–$0.10 zone
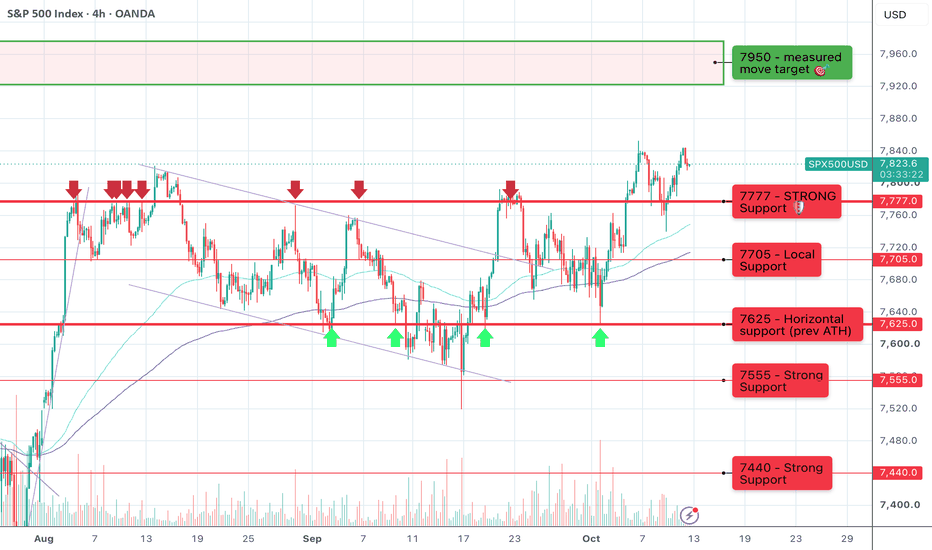
SPX: 7777 retest done. Measured move to 7950.Hey traders!🌴☀️
I haven’t updated my SPX outlook since September 10, as the “7625–7777 range identified in my previous posts remains relevant” , with price action unfolding within this range and repeatedly testing both boundaries 📈📉
It would also be unfair not to mention the nasty false breakdown below 7625🪓
Between September 10 and 17, price dropped toward 7555. However, I had covered this level separately, and it played out exactly as anticipated:
“…this is where the bears will really ha
MESZ Oct 12: Hold 7827 or Break 7896 Toward 7960?MESZ is trading around 7,860 after an overnight push higher.
My current bias is neutral to bullish, with price trading between two important higher-time-frame levels.
The main support zone sits around 7,827, where the lower-time-frame chart also shows an order-block/reaction area.
If buyers defend this zone with confirmation, I’ll continue watching for another push toward 7,896.
A confirmed 4-hour close above 7,896 would strengthen the bullish structure and could open continuation toward approxi
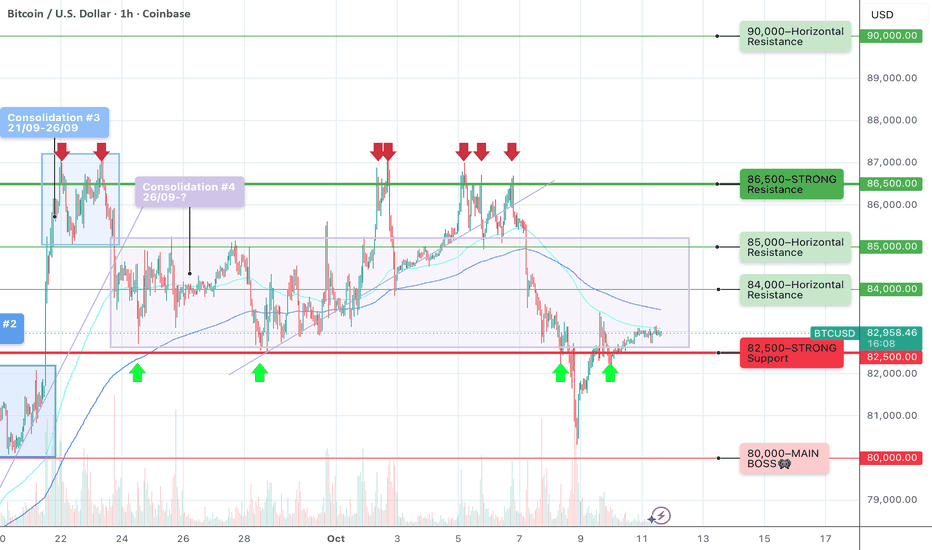
$82.5K Is Losing Its Grip? Monday’s Asian Session Will TellHey everyone!
Since Friday, Bitcoin has managed to hold above $82.5K, but we haven’t seen a strong move toward the upper boundary of the current range at $85K.
That’s not a great sign. Simply reclaiming a level isn’t enough to signal that bulls are gaining strength. Bulls need to see a combination of two things: reclaiming $82.5K and following through with a move toward the upper boundary of the range.
The longer BTC trades around current levels without making further progress, the weaker the
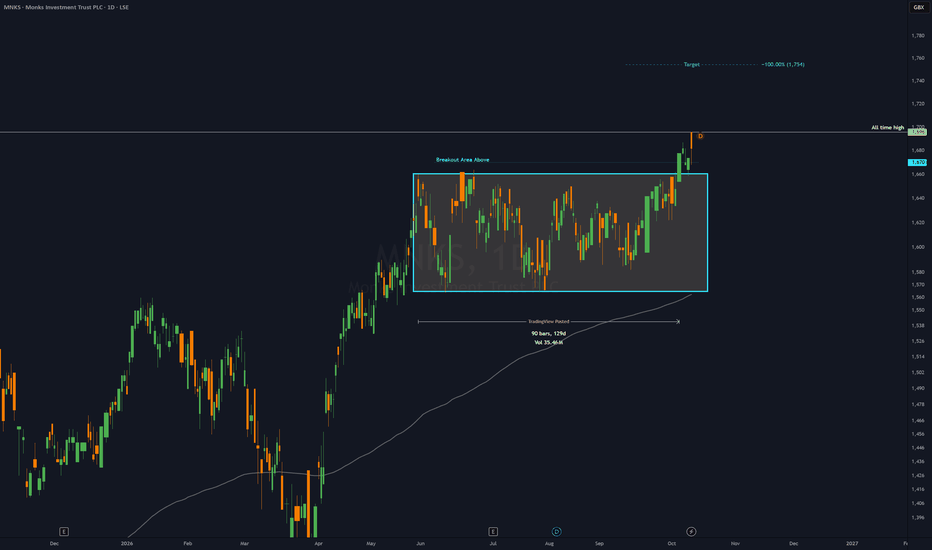
MNKS - 4 months RECTANGLE══════════════════════════════
Since 2014, my markets approach is to spot
trading opportunities based solely on the
development of
CLASSICAL CHART PATTERNS
🤝Let’s learn and grow together 🤝
══════════════════════════════
Hello Traders ✌
After a careful consideration I came to the conclusion that:
- it is crucial to be quick in alerting you with all the opportunities I spot and often I don't post a good pattern because I don't have the opportunity to write down a proper didactical comment;
- sin
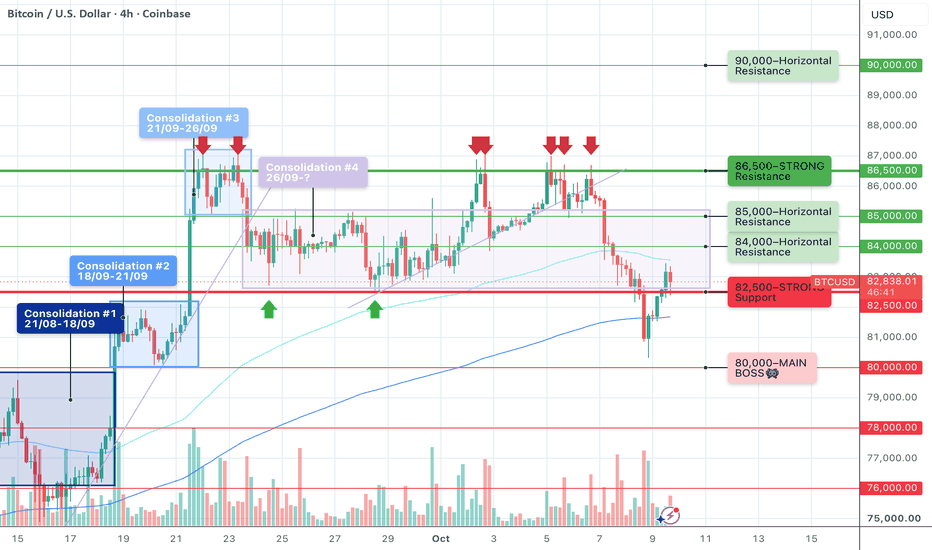
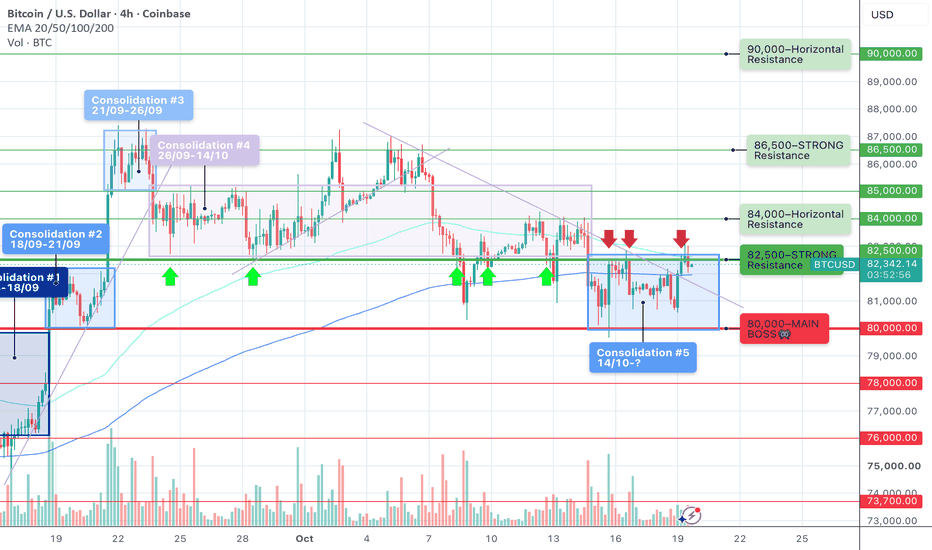
BTC: The $80K Level Is Still the Boss!Hey everyone!☀️
Wednesday and Thursday were tough days for the bulls this week 🔪🔪🔪
While the pullback toward $82.5K didn’t really damage the bullish structure, a break below $82.5K was enough to make everyone nervous.
Personally, I expected a reversal right around $82.5K level, as I mentioned in my last post. But if there’s one thing I’ve been emphasizing in my last post and the five before that, it’s the critical importance of $82.5K.
This was the last line of defense before the main boss:
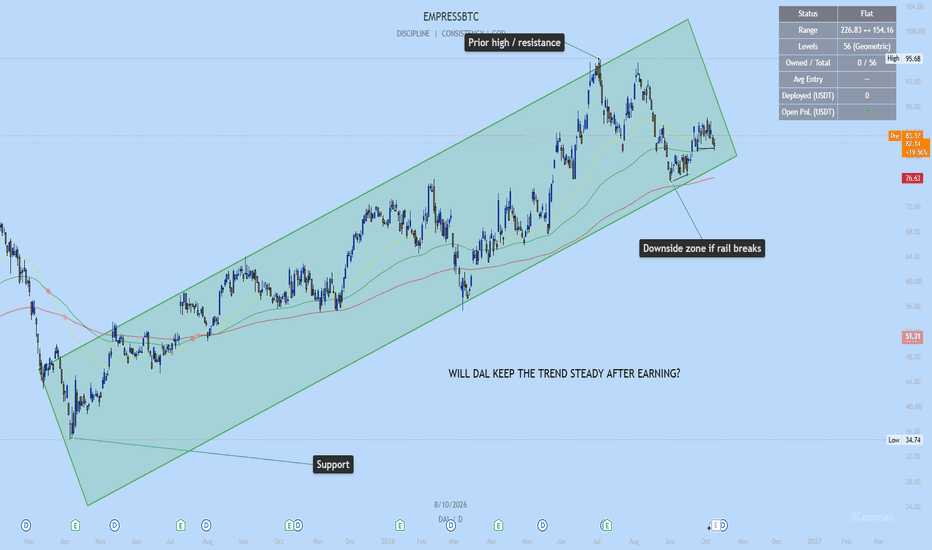
DAL Earnings: The EMAs Are Squeezing, Yields Are at 24-Year HighDelta reports Q3 before the open Friday, with consensus near $1.99 EPS. The chart is at a decision point, and the macro backdrop is what makes this earnings report matter more than most.
DAL bottomed at $34.74 in April 2025 and has climbed inside an ascending channel since. It peaked at $95.68 in July 2026 and made a lower high in August. Price now sits at $82.20, up about 137% from the low but about 14% below the peak.
The September low ($76) touched the lower rail and bounced. The rail has
USDJPY: Bullish Continuation 🇺🇸🇯🇵
USDJPY is positioned to rise further and reach 158.85.
Earlier, the market successfully completed a bullish accumulation within a horizontal range.
Its bullish violation provided a strong signal.
❤️Please, support my work with like, thank you!❤️
I am part of Trade Nation's Influencer program and receive a monthly fee for using their TradingView charts in my analysis.
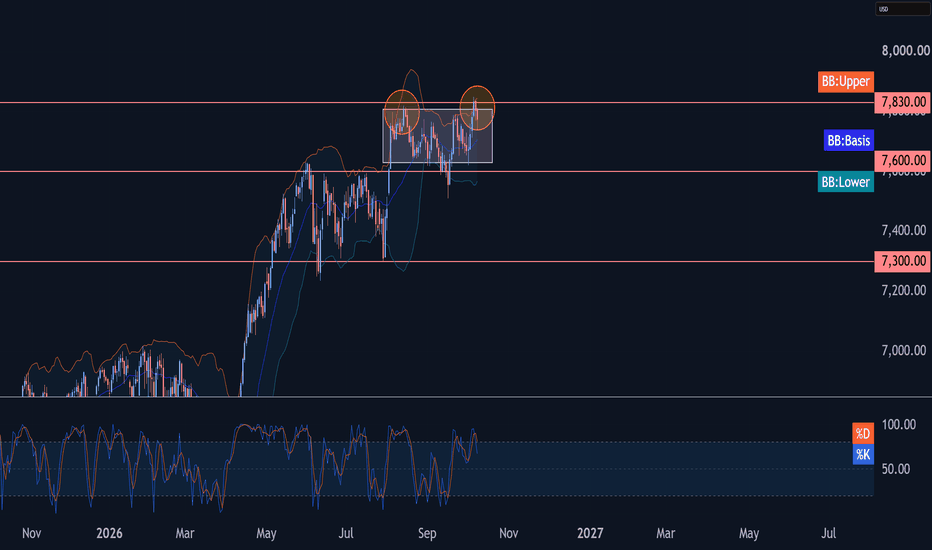
S&P 500 Wave Analysis – 8 October 2026
– S&P 500 reversed from resistance zone
– Likely to fall to support level 7600.00
S&P 500 index recently reversed down from the resistance zone between the resistance level 7830.00 (upper border of the sideways price range from the start of August, which stopped wave 1 in the middle of August and wave i at the end of September) and the upper daily Bollinger Band.
The downward reversal from this resistance zone stopped the earlier short-term upward impulse iii from the start of October.
Given
CHFJPY: Bearish Outlook Explained 🇨🇭🇯🇵
CHFJPY has been consolidating for a week within a horizontal range.
Its support was finally violated yesterday.
We can expect a bearish continuation after its retest.
Target will be 189.15
❤️Please, support my work with like, thank you!❤️
I am part of Trade Nation's Influencer program and receive a monthly fee for using their TradingView charts in my analysis.
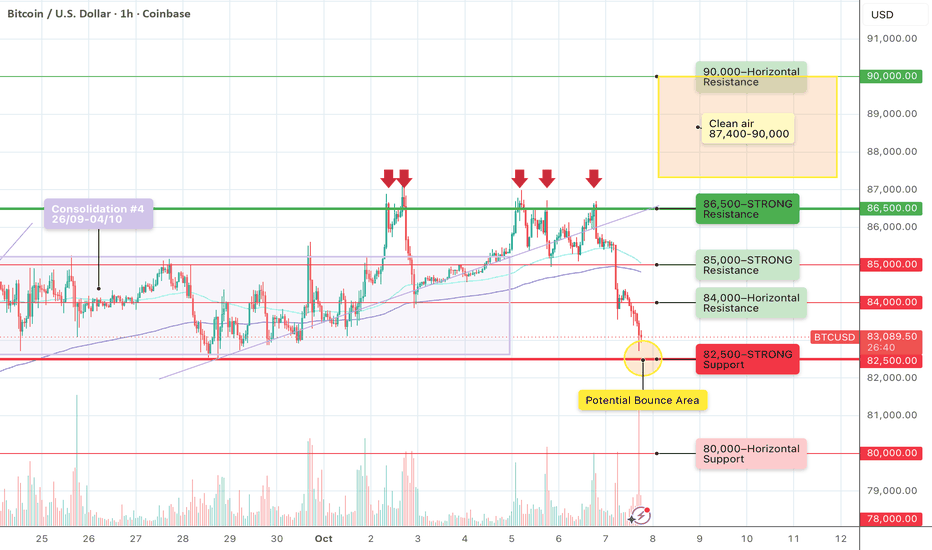
BTC: Last Line of Defense — The Final Boss Awaits!Hey everyone! 🌴
It’s been a rough week for the bulls, to say the least 🧨🪓🔪⚰️
On Tuesday, after the sixth failed attempt since September 21 to establish a foothold above the major $86.5K resistance, Bitcoin started rolling over. Today, the sell-off continued, with BTC breaking through several important support levels — $85K and $84K — and getting very close to $82.5K.
I’ve been outlining this bearish correction scenario in EVERY post since September 22, so I hope this move didn’t catch you com
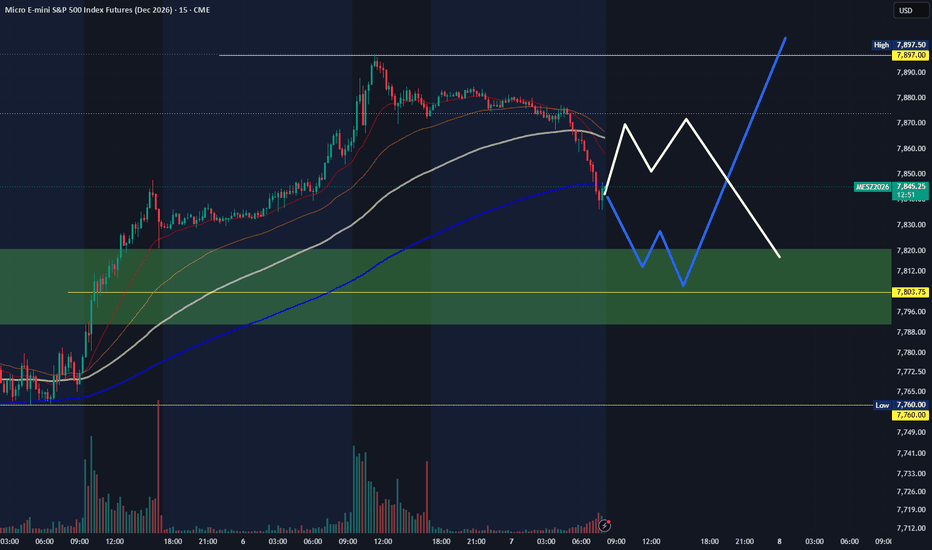
MESZ Oct 7: Pullback Into 7800 FVG Before Another Push Toward 78MESZ is trading around 7,843 after pulling back from yesterday’s high near 7,897.
The main area I’m watching today is the stacked 4-hour and 1-hour fair value gap around 7,800.
If price revisits that zone, I’ll look for bullish confirmation rather than assuming the level must hold.
A successful reaction from the FVG could support another move toward the major upside liquidity around 7,897.
On the downside, 7,760 is the key higher-time-frame invalidation level.
A confirmed 4-hour close below 7,76
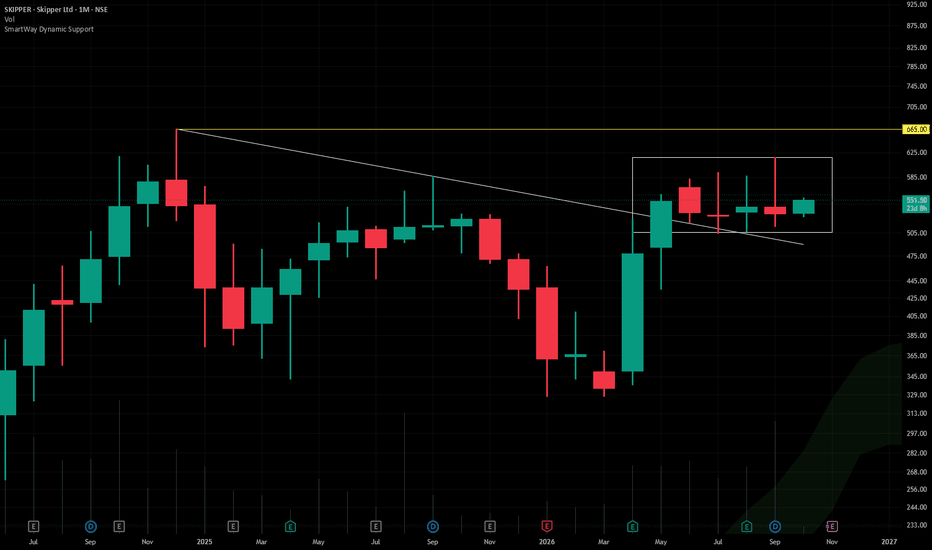
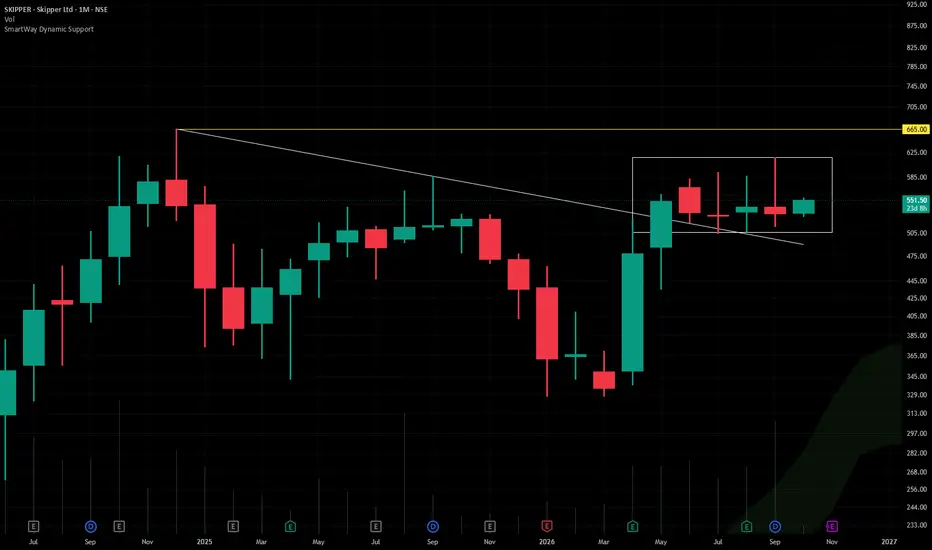
SKIPPERSkipper Ltd. (CMP ₹552.00, NSE: SKIPPER)
The SmartWay Research Desk | 7 October 2026
A Kolkata‑based infrastructure and engineering company, incorporated in 1981. Skipper Ltd. is one of India's leading manufacturers of power transmission towers, telecom towers, railway electrification structures, PVC pipes, and polymer products. The company serves major utilities, infrastructure developers, and government projects across India and exports to multiple countries.
Promoter Holding (Jun 2026)
MESZ Oct 6: Bullish Breakout Confirmed — 7881 Next?MESZ has confirmed the higher-time-frame breakout after a 4-hour candle closed above 7,815.
Price is now trading around 7,863, and the first upside liquidity target sits around 7,880–7,881.
Below current price, the green fair value gap remains an important support and reaction zone. A pullback into that area would not automatically invalidate the bullish structure.
On the 15-minute chart, liquidity around 7,820 is also worth monitoring as a possible deeper pullback target during the week.
The ke