Long
Long
H1 Bearish Retest From Major SupplyXAUUSD is trading around 4,366 after the latest recovery stalled beneath the 4,390–4,410 Major Supply Zone. H1 structure has improved through the recent MSS and BOS, but price is still trading underneath the broader bearish trendline and a major resistance cluster.
The macro backdrop also remains challenging for gold. The Fed raised the federal funds target range by 25 bp to 3.75%–4.00% on September 16 and said inflation remains elevated. On Monday, gold eased toward $4,370, while the U.S. 2-year Treasury yield moved around 4.76% as markets continued to digest hawkish Fed guidance. Minneapolis Fed President Neel Kashkari also said inflation remains too high and supported the latest rate increase, reinforcing expectations that policy could stay restrictive.
Technical View
The H1 chart shows a strong recovery from the 4,260 area, followed by MSS and BOS as buyers regained short-term control.
However, the rally has now reached a more important structural obstacle. The 4,390–4,410 Major Supply Zone overlaps with the descending bearish trendline and previous swing liquidity.
Price is currently pulling back toward the 4,335–4,355 Demand Zone. This zone could generate another short-term recovery, but from Mason’s view, that rebound would be more interesting as a potential retest into major supply rather than a place to chase longs.
If sellers defend the upper zone, the next meaningful downside objective sits around 4,280–4,300.
Below that, the deeper 4,235–4,250 Key Support / Demand Zone remains the larger liquidity area.
Key Zones
Current Price: 4,365.750
Major Supply / Sell Zone: 4,390–4,410
H1 Demand: 4,335–4,355
Next Downside Target: 4,280–4,300
Key Support / Demand: 4,235–4,250
Trading Plan
Sell Priority: 4,390–4,410
Condition: wait for price to retest Major Supply and show bearish rejection, liquidity sweep, lower-high formation or bearish MSS confirmation.
TP1: 4,335–4,355
TP2: 4,280–4,300
TP3: 4,235–4,250
Invalidation: sustained H1 acceptance above 4,410–4,420.
Sell View
The cleaner setup is not to chase shorts around current price while H1 demand remains directly underneath.
A rebound from 4,335–4,355 into 4,390–4,410 would provide a better location to evaluate seller strength.
The bearish idea only becomes attractive after confirmation from the upper supply zone.
Important Note
Oil prices eased slightly at the start of the week as Saudi export flows recovered, which may temporarily reduce inflation pressure. However, elevated short-term U.S. yields and the Fed’s restrictive stance remain key headwinds for gold.
Final View
Gold has recovered strongly, but H1 is now approaching a major technical decision area.
The main scenario is a retest into 4,390–4,410 followed by confirmed bearish rejection, targeting 4,335–4,355 first and then 4,280–4,300 if downside momentum expands.
Can sellers defend Major Supply and rotate gold back toward lower liquidity?  Short
Short
H1 Major Supply Rejection Toward Lower LiquidityXAUUSD is trading around 4,378 after extending its recovery from the lower H1 structure. Price has returned directly into the 4,385–4,405 Major Supply Zone, where the broader bearish trendline also remains relevant.
Gold reached a one-week high on Friday as easing crude oil prices reduced part of the inflation pressure that had dominated markets earlier in the week. Spot gold climbed about 1.2%, while softer energy prices helped Treasury yields retreat from their recent highs.
However, the broader macro backdrop remains restrictive. The Fed has raised rates to 3.75%–4.00% and still expects further tightening, while markets currently price roughly a 55% probability of another hike in October. The dollar also remains near a seven-week high, and the U.S. 10-year yield has recently traded above 5%, limiting the strength of gold’s recovery.
Technical View
The H1 recovery has improved after the recent MSS and rebound from lower demand, but price is now entering the main decision area.
The 4,385–4,405 Major Supply Zone aligns with the previous bearish trendline and recent swing structure. This makes the current area less attractive for chasing longs.
A rejection or failed acceptance above this supply could trigger a corrective move back toward the 4,335–4,350 Demand Zone.
If that demand fails to absorb selling pressure, the larger downside objective sits around 4,270–4,290, where the marked downside target and previous liquidity structure align.
Below that, the 4,235–4,250 Major Demand / SSL Zone remains the deeper structural support.
Key Zones
Current Price: 4,378.385
Major Supply / Sell Area: 4,385–4,405
Demand Zone: 4,335–4,350
Downside Target: 4,270–4,290
Major Demand / SSL: 4,235–4,250
Bearish invalidation: sustained H1 acceptance above 4,410–4,420
Trading Plan
Sell Priority: 4,385–4,405
Condition: wait for price to retest Major Supply and show bearish rejection, liquidity sweep, failed acceptance or lower-high confirmation.
TP1: 4,335–4,350
TP2: 4,270–4,290
TP3: 4,235–4,250
Invalidation: sustained H1 acceptance above 4,420.
Sell View
The cleaner approach is to avoid selling aggressively below current price after the recent recovery.
I prefer to let gold test 4,385–4,405 first. If sellers clearly defend the zone, the risk/reward improves for a rotation back toward demand.
A clean H1 breakout and acceptance above 4,420 would weaken the immediate bearish scenario and require reassessment.
Important Note
Lower oil prices are helping gold recover in the short term, but the Fed’s renewed tightening cycle, a strong dollar and elevated Treasury yields remain important headwinds. This creates a two-sided environment where liquidity sweeps around resistance may be aggressive.
Final View
Gold has recovered strongly, but H1 is now testing a key supply area rather than trading from clean demand.
The main scenario is a retest and rejection from 4,385–4,405, followed by a move toward 4,335–4,350 first and potentially 4,270–4,290 if bearish momentum expands.
Will H1 Major Supply stop the recovery before gold rotates back toward lower liquidity? Short 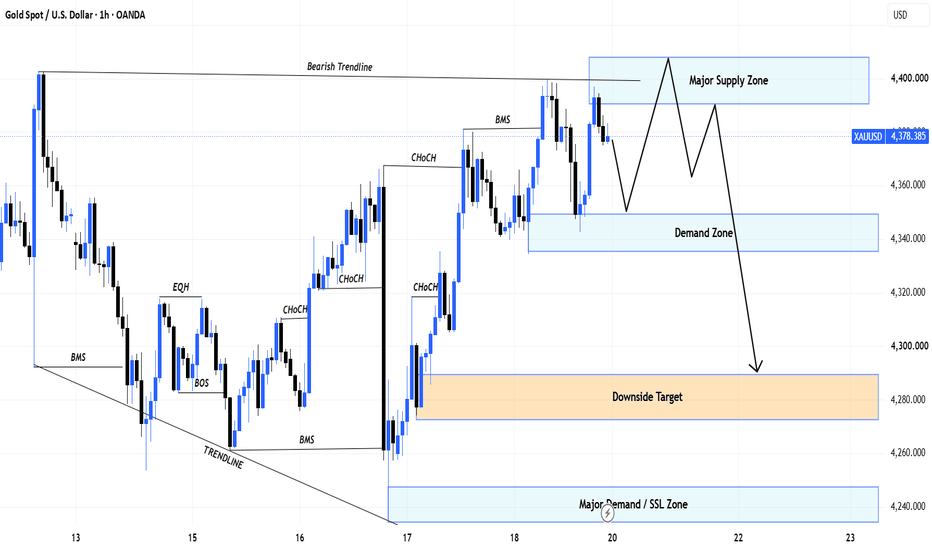
 Long
Long
 Short
Short
Long 
Long 
Long 
H2 Bullish Reclaim Toward Major Supply
XAUUSD is trading around 4,413 after recovering from the recent 4,350 area and compressing between the descending resistance trendline and rising short-term support. Price is now approaching the first resistance zone, making the next reclaim especially important.
Gold gained more than 1% on Wednesday as the U.S. dollar remained soft, while escalating Middle East tensions pushed Brent above $100. However, the U.S. 10-year Treasury yield climbed toward 4.84%, and markets are pricing roughly a 60% probability of a Fed hike next week, keeping the macro backdrop highly sensitive to inflation data.
The next catalysts are U.S. PPI today, September 10, at 8:30 a.m. ET, followed by CPI on September 11 at 8:30 a.m. ET. Both releases could materially shift Fed expectations and create sharp volatility in XAUUSD.
Technical View
The broader structure remains below the descending resistance line, but short-term price action is showing signs of recovery.
The immediate decision area is 4,415–4,445 Resistance. A clean reclaim and successful retest of this zone would strengthen the bullish structure and support continuation toward the next supply.
The first major upside objective sits around 4,490–4,515 Supply Zone.
If buyers maintain momentum above that area, the larger target becomes the 4,600–4,635 Major Resistance / Supply Zone.
Below current price, the 4,285–4,310 Demand Zone / Strong Support remains the major structural support on the chart.
Key Zones
Current Price: 4,412.820
Resistance / Reclaim: 4,415–4,445
Supply Zone: 4,490–4,515
Major Resistance / Supply: 4,600–4,635
Major Demand / Strong Support: 4,285–4,310
Trading Plan
Buy Priority: confirmed reclaim of 4,415–4,445
Condition: wait for price to break above resistance and confirm the zone as support through a retest, bullish rejection or higher-low formation.
TP1: 4,490–4,515
TP2: 4,600–4,635
Invalidation: failure to hold the reclaimed resistance structure would weaken the immediate bullish continuation setup.
Important Note
PPI and CPI are the main short-term risks. With oil above $100 and Treasury yields elevated, hotter inflation could quickly strengthen Fed-hike expectations and pressure gold.
Avoid chasing a breakout during the first reaction to the data. Confirmation after the liquidity sweep remains more important than the initial candle.
Buy View
The preferred scenario is not to buy directly below resistance.
A confirmed breakout above 4,415–4,445, followed by a controlled retest, would provide the cleaner bullish setup. If buyers establish acceptance above this area, 4,490–4,515 becomes the next liquidity objective.
Final View
Gold is attempting to transition from consolidation into a stronger recovery phase, but 4,415–4,445 remains the key gate.
The main scenario is a bullish reclaim and retest of resistance, followed by expansion toward 4,490–4,515 and potentially 4,600–4,635.
Can gold reclaim 4,445 before PPI and CPI trigger the next major expansion? Long 
 Long
Long
Long 
 Short
Short
XAGUSD 4H | Pullback Into Order Block Before Potential ContinuatMarket Structure
XAGUSD remains within a broader bullish market structure on the 4-hour timeframe. The chart shows a sequence of higher highs and higher lows, with multiple breaks of structure (BOS) confirming the upside progression.
Price recently pushed into the weak high / liquidity area near the recent peak and then produced a strong bearish displacement. This suggests that the immediate focus is now on the downside retracement and how price reacts around the marked demand areas.
Key SMC & Price Action Zones
Supply Zone: 70.20 – 71.20
This area contains the recent weak high and potential buy-side liquidity. Price has already reacted sharply from this region, making it an important reference point for any future upside continuation.
Order Block / FVG: 63.40 – 64.50
The first key reaction zone below current price. A retracement into this imbalance and order-block area may provide important information about whether buyers are still defending the broader bullish structure.
Demand Zone: 61.20 – 62.70
This is the deeper support area. If price moves through the first reaction zone, this region becomes the next important area to watch for a potential bullish response.
Possible Scenario
The current bearish move may continue toward the Order Block / FVG, where price action can be monitored for a potential reaction. A sweep into the zone followed by bullish confirmation could support a continuation back toward the previous highs.
A deeper retracement into the Demand Zone would still be consistent with the broader bullish structure, provided price does not show sustained bearish acceptance below the key structural support.
What to Watch
Bearish momentum as price approaches the 63.40–64.50 reaction zone
Liquidity sweep or rejection inside the Order Block / FVG
Lower-timeframe CHoCH or BOS as confirmation of a potential bullish response
A deeper move toward 61.20–62.70 if the first zone fails to hold
Previous highs and nearby buy-side liquidity as a possible upside reference
Overall Bias: Broader bullish structure, with a short-term bearish retracement currently in progress. The next directional clue is likely to come from the reaction inside the marked SMC zones.
This idea is based on market structure, liquidity concepts, Fair Value Gaps, order blocks, and price action. It outlines possible scenarios rather than guaranteed outcomes Long 
XAUUSD H1: Bullish Structure Shift & FVG Retest in FocusGold has transitioned from a clear bearish structure into a potential bullish market-structure phase
After the decline into the 4,280–4,300 demand area, price formed a strong recovery and produced a CHOCH, followed by bullish displacement. The subsequent structure suggests that buyers have gained short-term control
Price is now retracing toward the 4,365–4,400 FVG zone, making this area important for monitoring how price reacts
🔎 Key Levels
Current price: ~4,430
FVG: ~4,345–4,368
Key demand: ~4,280–4,300
Previous swing area: ~4,480–4,500
BSL: ~4,637
Higher BSL: ~4,690
📈 Bullish Scenario
If the FVG holds and price establishes bullish confirmation on a lower timeframe, the next areas of interest would be the previous swing high and potentially the 4,637 BSL.
The idea remains conditional: a reaction from the FVG is more meaningful than simply assuming the zone will hold
⚠️ Bearish Invalidation
A sustained breakdown through the bullish structure and especially the 4,280–4,300 demand area would weaken the current bullish thesis and suggest that the broader bearish pressure may be returning
Educational market analysis only. This is a scenario-based interpretation of price action, not a guarantee or investment advice. Always consider your own risk management Long 
Long 
XAUUSD 4H — Reaction From H4 FVG Could Define the Next Leg MarkGold has experienced a strong bearish displacement from the 4,600 area into the 4,300–4,320 region. Price is now approaching a previously identified H4 Fair Value Gap (FVG), with a deeper H4 Order Block (OB) below it.
Technical view
Current price: ~4,322
H4 FVG: roughly 4,275–4,305
H4 OB: roughly 4,220–4,260
Upside liquidity: around 4,625 and 4,695
The recent sell-off has created a significant imbalance, so the FVG/OB area is important for assessing whether buyers can regain control.
The LQ sweep near the recent low adds confluence, but confirmation is still required.
Bullish scenario
If price retraces into the 4,275–4,305 FVG and shows a clear bullish reaction, the area could act as support. A sustained recovery above the nearby structure would strengthen the case for a move toward the 4,625 liquidity level, with the higher 4,695 area as a secondary objective.
Invalidation / bearish scenario
If price decisively breaks and holds below the H4 OB around 4,220–4,260, the bullish thesis would lose strength and the market could continue its broader bearish structure.
Key idea: Rather than assuming an immediate reversal, I would watch how price behaves inside the H4 FVG/OB zone. The reaction there should determine whether this is a retracement opportunity or continuation of the bearish move.
TradingView-safe note: This wording focuses on chart analysis, reasoning, conditional scenarios and invalidation rather than presenting a guaranteed result or a bare “BUY/SELL” call. TradingView specifically recommends explaining why the view exists and what would invalidate it; it also prohibits promotional content and after-the-fact ideas.
Suggested title
XAUUSD 4H: H4 FVG Reaction Could Shape the Next Move
Suggested TradingView description — ready to paste
Gold is currently trading near an important H4 imbalance after a strong bearish displacement from the 4,600 area.
The H4 FVG around 4,275–4,305 is the first area I am watching for a potential reaction, while the H4 OB around 4,220–4,260 represents a deeper support zone.
If price respects the FVG/OB area and develops bullish confirmation, attention could shift toward the upside liquidity around 4,625, followed by the 4,695 region.
A sustained break below the H4 OB would weaken this bullish scenario and suggest that the bearish structure remains dominant.
For now, the reaction around these H4 zones is more important than anticipating the direction prematurely Long 
Gold Spot (XAU/USD): 1H Market Structure Breakdown & IDR🧠 Detailed Technical Breakdown
1. Macro Trend & Shift in Delivery: Following a series of bullish Break of Structure (BOS) prints driving price to historic highs near $4,720.00, Gold experienced a heavy displacement sell-off that triggered a clear Market Structure Shift (MSS) on the 1H chart below the 100 EMA ($4,483.95).
2. Demand Zone Test & Retracement Logic: The steep drop has directly expanded into a heavily refined Demand Zone ($4,330.00 – $4,350.00). Price is currently showing early absorption tails right at $4,343.20 as lower-timeframe sellers lose momentum.
3. Inversion FVG (IFVG) & Overhead Supply: If price holds this key demand, the initial upside pull-back targets the IFVG at $4,400.00, followed by the primary pool of Buy-Side Liquidity (BSL) near $4,460.00. A full macro retrace leads directly back up into the Overhead Supply Zone ($4,600.00 – $4,630.00).
4. Downside Invalidation & Major Discount Value: A break and 1H candle close below the immediate Sell-Side Liquidity (SSL) line at $4,320.00 invalidates this immediate demand play. If swept, the path opens up toward the macro Bullish Order Block ($4,150.00 – $4,170.00) sitting at major discount levels.
📌 Trade Management & Execution
Trigger: Look for a bullish 1H candle closing confirmation (or a 5m/15m Change in State of Delivery) inside the $4,330.00 – $4,350.00 Demand Zone.
Invalidation Rules: Move Stop Loss to breakeven once price reaches TP1 ($4,400.00 IFVG) and secure 50% partial profits.
Risk Protocol: Limit account exposure to a maximum of 1% to 2% per trade setup.
📌 Signal Summary
Asset Pair: Gold Spot / U.S. Dollar (XAU/USD)
Timeframe: 1 Hour (1H)
Trade Direction: Long (Re-Accumulation Execution off Higher Timeframe Demand)
Entry Zone: $4,330.00 – $4,350.00 (Key 1H Demand Zone)
Stop Loss (SL): $4,310.00 (Placed below the Immediate SSL Sweep Line)
Take Profit 1 (TP1): $4,400.00 (1H Inversion Fair Value Gap - IFVG)
Take Profit 2 (TP2): $4,460.00 (Buy-Side Liquidity - BSL)
Take Profit 3 (TP3): $4,600.00 (Overhead Supply Zone)
Risk/Reward Ratio: ~1:3.5 (to TP2) / 1:12.5 (extended to HTF Supply Zone)
⚠️ Disclaimer: For educational and institutional analysis purposes only. Not financial advice. Always execute proper position sizing and risk management strategies! 🛡️
#XAUUSD #Gold #TradingView #SmartMoneyConcepts #DemandZone #PriceAction #DayTrading #TechnicalAnalysis #Forex Short 
Gold Spot / USD — 15m | Bearish Retracement SetupMarket structure:
XAUUSD is showing a short-term bearish structure after rejection from the 4,455–4,458 supply zone. Price is currently around 4,427, so chasing the move lower is less attractive. The cleaner approach is to wait for a retracement into the marked supply area.
Key levels
Supply zone: 4,449–4,458
Secondary resistance / BSL: 4,460–4,462
Major resistance: 4,465–4,474
Current price: ~4,427
First downside area: 4,420
Demand / SSL area: 4,395–4,408
Scenario
If price retraces into 4,449–4,458 and shows bearish rejection, continuation toward the lower liquidity/demand areas becomes technically interesting.
Potential path:
Supply → rejection → 4,440 → 4,420 → 4,408–4,395
A sustained move above the 4,474 resistance area would weaken this bearish scenario and invalidate the current structural thesis.
TradingView-ready description
Gold is currently trading below the marked supply zone after a strong rejection, leaving the short-term structure tilted bearish.
Rather than chasing the current downside move, I am watching for a retracement into the 4,449–4,458 supply zone. A clear rejection from this area would provide confirmation for a possible continuation toward 4,420, followed by the 4,408–4,395 demand/liquidity area.
The 4,460–4,474 region remains important overhead resistance, with buy-side liquidity sitting above the recent highs. A sustained break above this area would invalidate the bearish scenario and shift attention back toward higher levels.
For now, patience is key: the setup is based on price returning to the zone and confirming rejection rather than entering after an extended move. Short 
XAUUSD Structure Roadmap $4,466 Breakout to $4,570 Golden SupplyAnatomy of an Accumulation Phase: Mapping Gold's Path to the $4,570 Golden Supply Zone
✨ Educational Overview: Accumulation, Manipulation & Distribution (AMD)
When markets consolidate after a sharp sell-off, smart money often constructs an Accumulation Phase to build liquidity before expanding upward to mitigate higher-timeframe supply imbalances. Understanding where short-term momentum ends and premium supply begins is critical to managing risk-to-reward effectively.
🎓 Technical Breakdown & Market Logic
1. Accumulation & Bullish Divergence:
Price is building bottoming structure around lower timeframe support, accompanied by visible bullish divergence along ascending trendlines. This suggests sell-side liquidity is absorbed and a short-term relief rally is priming. 📈
2. Near-Term Resistance Break ($4,466.00):
A confirmed candle close above the $4,466 Strong Resistance level opens the doorway for a temporary breakout. This short-term bullish expansion serves to sweep internal liquidity and fill the higher Bearish FVG ($4,510 area) along the way. 🚀
3. Premium Supply Zone + Fibonacci Golden Pocket ($4,560 – $4,570):
The long position is designed for a limited time/distance because the ultimate institutional target sits at $4,560 – $4,570. This zone creates a powerful confluence:
Major Supply Zone originating from prior impulsive break of structure (BOS).
Fibonacci Golden Pocket retracement levels (0.68, 0.72, 0.78).
Aligning closely with the higher-timeframe 100 EMA dynamic resistance.
⚡ Hypothetical Execution Parameters (Educational Study)
Phase 1: Short-Term Breakout Long
Trigger Entry: Confirmed 15m candle break/retest above $4,466.00 🔑
Stop Loss (SL): $4,448.00 (Below local consolidation structure) 🛑
Target Zone: $4,560.00 – $4,570.00 (Premium Supply Mitigation) 🎯
Phase 2: Premium Supply Rejection (Macro Sell Zone)
Sell POI: $4,560.00 – $4,570.00 🎯
Confirmation: Rejection candlesticks / lower-timeframe Market Structure Shift (MSS) within the Golden Fib zone.
Target: Expansion back down into lower liquidity pools. 📉
💡 Key Takeaway for Traders
Never mistake a short-term liquidity push into supply for a full-fledged macro bull trend. Recognizing where the market transitions from demand completion to premium supply rejection helps avoid buying at the absolute top of an accumulation-manipulation cycle.
⚠️ Disclaimer: Not financial advice. This chart setup is strictly for educational, structural, and market analysis purposes. Always practice strict risk management and position sizing. 🛡️
#XAUUSD #Gold #TradingView #SmartMoneyConcepts #SupplyAndDemand #Fibonacci #MarketStructure #PriceAction #DayTrading Long 

 Short
Short Short
Short