AUDJPY: Pullback From Support 🇦🇺🇯🇵
AUDJPY is positioned to rise after a test of a significant daily support cluster.
A double bottom pattern formation and a valid bullish CHoCH on an hourly time frame
provide strong confirmations.
Goal - 113.0
❤️Please, support my work with like, thank you!❤️
I am part of Trade Nation's Influencer program and receive a monthly fee for using their TradingView charts in my analysis.
Wolfe Wave
HAL triangle breakoutThere was triangle breakout in early August.
It has also come to retest the breakout levels.
Now that retest seems complete a next strong move till 7000 is likely which is a target based on triangle.
This week low can be used as stop loss..
Considering this being weekly chart targets are likely to come in 4 to 8months time.
BITCOIN - Consolidation Following Strong GrowthBINANCE:BTCUSDT.P , after a strong rally, has entered a consolidation phase near the resistance formed by the technical retracement of the previous bear cycle. What happens next?
Bitcoin previously broke the structure of its bearish trend, but it has still not tested the 83,000 technical retracement zone, which also represents a liquidity pool. Therefore, we can assume that this target remains relevant within the current local bullish trend.
After the strong rally, price has been consolida
Master the Inverse Head & Shoulders PatternThe weekly chart of NEducational Spotlight: The chart offers a textbook lesson on how markets transition from a major markdown cycle into a clean bullish reversal structure. Let’s break down the mechanics of this high-probability setup.
🔍 1. Understanding the Market StructureAfter hitting local highs near ₹290, the stock experienced a prolonged corrective phase, printing lower highs and lower lows.The reversal began when price stopped chasing new lows, transitioning into a multi-month accumulation pattern known as
JPN225: 3% yields, a descending triangle,Here Is the Trade!The video has a detailed analysis of the Japan 225 and the trade setup that I have created as of 3 September 2026, the day when Japan's 10 year bond yield topped 3% for the first time since 1996 as US-Iran airstrikes increase oil prices, global inflation expectations rise, yen strengthens amid BOJ rate hike check speculation and the index falls 2.85% to four-week lows at 64,325. Nikkei index currently trades 12% down from its June peak of 73,007. Descending triangle has been developing quietly s
M&M Financial Services – Attempting a Trend Reversal?🔹 **Trend:** Recovery phase after taking support near the 270 zone.
🔹 **Support Zone:** 270 – 280
🔹 **Resistance Zones:**
• 340 (previous swing resistance)
🔹**50 EMA:** ~315
🔹 **200 EMA:** ~306
🔹 **Volume:** Improved participation visible during the recent bounce.
🔹 **Price Structure:** Potential double-bottom formation around the 270 area.
🔹 **Momentum:** RSI has recovered from lower levels and is moving higher, indicating improving strength.
🔹 **What to Watch:**
• Sustaining above the
The Market Cycle in Action: Is LULU Building Its Next Base?Markets don't reverse overnight.
Before major rallies begin, strong stocks often transition through recognizable phases of the Market Cycle.
LULU appears to be approaching one of those moments.
📉 1. Markdown
After reaching its all-time highs, LULU entered a prolonged markdown phase.
Lower highs and lower lows kept sellers firmly in control as price gradually lost momentum.
This is where optimism slowly turns into pessimism.
📦 2. Long-Term Support & Accumulation
After months of decline, p
Gold Just Invalidated the Downside — Inverse Head & Shoulders The market does not care about your previous bias. When structure changes, the plan must change with it.
In the last published view , Gold was working inside a bearish leg. That scenario is now losing validity.
Price failed to extend lower, reclaimed key short-term territory, and has printed a clean Inverse Head and Shoulders on the H1 timeframe.
Left shoulder, head, and right shoulder are clearly defined. The neckline has been tested and price is attempting to build acceptance above it. Thi
BNB bullish signs of growth🐂 BULLS ARE WATCHING CLOSELY… 👀
🔺 Triangles are in play…
🚩 The flag is flying…
🎯 But will these patterns actually make their targets? 🚀
OR…
💰 Will the bulls bank the profits, momentum dries up and the whole thing fizzles out? 🫠📉
👀 Breakout or fakeout?
Let’s see what the market gives us… 🐂⚔️🐻
Bull or Bear break out ?🔺 TRIANGLE WATCH — DON’T GET TOO EXCITED YET! 👀
🐂 BULLS: The triangle is still sitting under the bear trend line, so no victory laps just yet! 😅
🚀 BUT… if we get a clean breakout, this could turn into a very nice call. 🎯
🐻 BEARS: There’s a flaw in the technical setup…
📊 Volume is concentrated towards the lower part of the triangle, which tends to favour the bear case. ⚠️
🌱 Personally, I think we’re in a bottoming process — but as we all know, bottoms can be VERY tricky! 🔪
We’ve also had a
PRIMEUSD just breaking out most likely bullish break 🐂 BULLS — THIS ONE’S FOR YOU! 🚀
📈 Bulls can go long off this chart.
⏱️ It was the 5-minute chart that first signalled to me that the triangle 🔺 had formed and was ready to POP! 💥
👀 Now the longer-term trend line is being broken as we speak, as shown in the chart.
🔥 Breakout underway… let’s see if the bulls can keep the momentum going! 🐂🚀
🍀 Good luck with your trading out there!
The game is a foot! 👀 SPOT THE DIFFERENCE?
🐂 Lots of bullish things going on here… BUT then the US Treasury Secretary, Scott Bessent, says… ❓🤔
🚶♂️💨 “Move along… nothing to see here!” 😴
Meanwhile… 🌱📈
🟢 The first serious green shoots we’ve seen in just about a YEAR! 🚀🔥
Bull trap… or is something finally changing? 👀
JUPUSD attempting to triangle bottom its way back into bull mode🐂 BULL CASE
🔺 Triangles often form around market bottoms
📈 Trend line has broken to the upside
🎯 Bearish targets have been met
🔪 But calling the exact bottom is like catching a falling knife
🚀 Crypto indexes are breaking out of long-term patterns to the upside
🐻 BEAR CASE
😴 Hibernation time again… 🥶
Possible another leg down, price back into the apex would be a nice place to add if you are going to play the bull side - Just watch out if this is wrong and the lower yellow trend line gets brok
Bitcoin appears to be breaking upward from bullish pennant. The most important thing to secure in the current bullish impulse happening on bitcoin is simply just securing a higher high for the current bullish trend. All price action has to do to secure that higher high is reach around 83k or so and go above this green horizontal trendline. However, should bitcoin decide it’s going to hit the full breakout target of the bullish pennant it appears to be breaking upward from at the moment, that could take it all the way to the full breakout target of $96,20
SPCX - 50 SMA Breakout with Small Cup & Handle💡 Swing setup idea
Break above the 50-day moving average into resistance while closing a small cup-and-handle pattern
🔎 Analysis summary:
The stock just broke above the 50-day moving average, reached resistance and completed a small cup-and-handle structure. This confluence of trend, pattern and level makes the breakout area key to watch. The upside potential is projected by the height of the cup from the breakout point.
👀 Levels to watch:
Entry trigger: Break above $147.10
Target: $186.
Can we get to last month's highs?We are currently in a down trend, but NASDAQ:GOOGL is looking slightly bullish after sweeping out the double bottom (on the 4hr tf).
If it can close above the 4hr gap we are in and break-out of the trend, we could see low 360's in a few days to a week.
It's a bit presumptuous, but I bought calls and will be adding more tomorrow if GOOGLE plays out exactly how I think it will.
Ethereum Is Building A New Pattern. Confirmation Still Required.We already took ETH exposure on the previous expansion.
Now the market is forming a new structure — and structure without confirmation is only a scenario.
Technical Structure (4H)
After the strong impulse leg, Ethereum has been consolidating inside an ascending triangle. Higher lows are forming cleanly against a flat resistance ceiling. This is a constructive compression pattern, but it is not confirmed until price breaks and closes above the triangle resistance with conviction.
Until that
Falling Wedge Breakout Opens the Door to ATH Retest — Major HTF XRP / USD — 1W
XRP continues to show a constructive higher-timeframe structure following its breakout from a multi-month falling wedge.
The first part of this thesis is relatively straightforward: price has broken above the wedge's descending resistance and is now attempting to hold the breakout area. If that breakout remains valid, the next major technical objective is a retest of the prior all-time-high region near $3.27.
The larger structure is where the chart becomes particularly interest
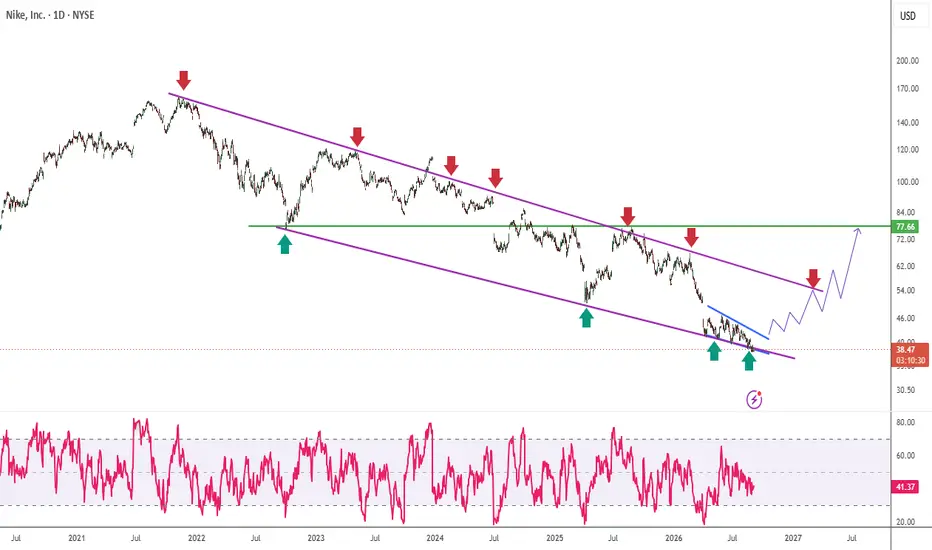
Nike (NKE) Offering Opportunity for the UpsideNYSE:NKE
🚨 Bullish Reversal Setup Building — But LH–LL Structure Still Matters
The chart is showing multiple bullish reversal confluences, but the larger trend has not yet completely shifted.
🟢 Bullish Signals
1️⃣ Daily Falling Wedge
Price is attempting to develop a Falling Wedge pattern on the daily timeframe. If price remains inside the structure and eventually breaks to the upside, it could signal that bulls are beginning to regain control.
2️⃣ Weekly Descending Channel
A broader desce
ETHUSD: Ascending Triangle Breakout & Execution PlanOverview
1. Technical Analysis & Chart Structure
Ethereum (ETHUSD) on the 1-Day Bitstamp chart is demonstrating a clear Ascending Triangle consolidation pattern following a sharp impulse move off its summer lows.
Support Zone ($2,387 – $2,500): This horizontal boundary serves as the main support level. It aligns with previous resistance, creating a key area where buyers are stepping in.
Dynamic Trend (50 EMA): The 50-day Exponential Moving Average (the blue line) is curving upward, offer
IE: Broadening Wedge Breakout Retest Could Set Up a 45%+ RallyIE recently completed a bullish breakout from a broadening wedge pattern, signaling a potential shift in momentum after a prolonged period of consolidation. Following the breakout, the stock is now undergoing a healthy retest of the breakout zone, a common technical behavior that often determines whether the breakout can develop into a sustained uptrend.
The current pullback remains constructive as long as price continues to hold above the key bullish level at $10.00 on a daily closing basis. T
A Boringly Predictable $76-80K Range… Until Today’s U.S. SessionHey traders! 📈💎☀️
I haven’t updated my outlook for the past few days because I was taking a break from the charts and enjoying some time in the mountains 🏔️
In all of my recent posts, I’ve been talking about the ongoing consolidation within the $76K–$80K range and the importance of the bulls building a solid base around the current levels before attempting another leg higher and turning this parabolic move into a more technically structured uptrend. 🛡️🛡️🛡️
Since my last post on Saturday, Bi


