Centro de Mando Quant: Z-Score & F*cking Sortino Ratio
What the f*ck is up, traders? Listen to me. If you are looking for a magical indicator that paints little green and red arrows to tell you when to buy and sell like a toddler, keep walking. This tool is not for you.
90% of retail traders get absolutely slaughtered in the markets because they trade based on emotions, hope, and imaginary lines drawn blindly on a chart. This script was forged with a strictly military and quantitative mindset. We don't guess here; we calculate probabilities, standard deviations, and asymmetric risk.
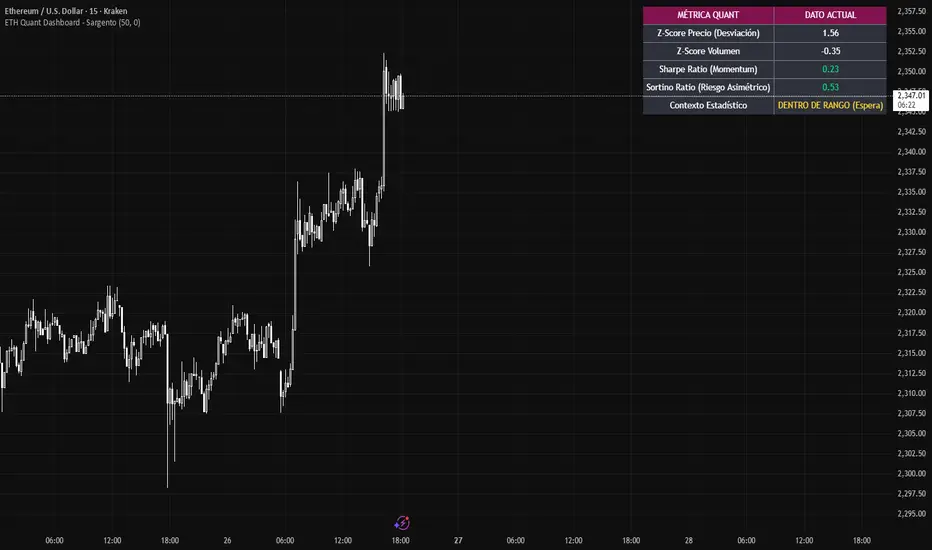
I present to you the Quant Command Center, a rolling tactical dashboard designed specifically to measure the guts of any highly volatile crypto, without cluttering your price action.
⚙️ THE QUANTITATIVE ARSENAL (Under the Hood)
This panel does NOT give automated signals. It gives you raw data so YOU can make the decision to pull the trigger.
Price Z-Score (Statistical Anomalies): Calculates how many standard deviations the current price is from its mean. If the Z-Score breaks +2.5 or drops below -2.5, you are looking at an unsustainable parabolic move. It tells you exactly when the market is overextended so you stop buying the top out of pure FOMO.
Volume Z-Score: Confirms if the current move is backed by heavy artillery (institutional money) or if it's just a weekend skirmish with zero real volume.
Rolling Sharpe Ratio: Measures the performance of price action against total volatility over the selected period.
The Sortino Ratio (Asymmetric Risk): The real survival filter. Unlike the Sharpe ratio, Sortino ONLY penalizes downside volatility. If the Sortino is red, the trend will tear you apart. If it's green, the bullish momentum has a clear, clean path.
🛠️ TACTICAL INSTRUCTIONS
Apply the indicator on 1H or 4H timeframes to filter out market noise.
Keep your eyes locked on the Statistical Context in the bottom right panel.
Use extreme Z-Scores to hunt for Mean Reversions or to lock in your profits.
Use positive Sortino ratios to confirm your entries on Breakouts.
"In war and in the markets, hope is not a tactical strategy. Cold data and discipline are your only salvation."
If you aren't willing to manage your risk, this dashboard won't save you. But if you have the discipline to read the numbers, plan your trade, and execute without hesitation, this tool will give you an unfair statistical advantage over the rest of the market.
Lock and load. Do your backtesting, execute your plan, and stop giving your money away to the market. Dismissed!
90% of retail traders get absolutely slaughtered in the markets because they trade based on emotions, hope, and imaginary lines drawn blindly on a chart. This script was forged with a strictly military and quantitative mindset. We don't guess here; we calculate probabilities, standard deviations, and asymmetric risk.
I present to you the Quant Command Center, a rolling tactical dashboard designed specifically to measure the guts of any highly volatile crypto, without cluttering your price action.
⚙️ THE QUANTITATIVE ARSENAL (Under the Hood)
This panel does NOT give automated signals. It gives you raw data so YOU can make the decision to pull the trigger.
Price Z-Score (Statistical Anomalies): Calculates how many standard deviations the current price is from its mean. If the Z-Score breaks +2.5 or drops below -2.5, you are looking at an unsustainable parabolic move. It tells you exactly when the market is overextended so you stop buying the top out of pure FOMO.
Volume Z-Score: Confirms if the current move is backed by heavy artillery (institutional money) or if it's just a weekend skirmish with zero real volume.
Rolling Sharpe Ratio: Measures the performance of price action against total volatility over the selected period.
The Sortino Ratio (Asymmetric Risk): The real survival filter. Unlike the Sharpe ratio, Sortino ONLY penalizes downside volatility. If the Sortino is red, the trend will tear you apart. If it's green, the bullish momentum has a clear, clean path.
🛠️ TACTICAL INSTRUCTIONS
Apply the indicator on 1H or 4H timeframes to filter out market noise.
Keep your eyes locked on the Statistical Context in the bottom right panel.
Use extreme Z-Scores to hunt for Mean Reversions or to lock in your profits.
Use positive Sortino ratios to confirm your entries on Breakouts.
"In war and in the markets, hope is not a tactical strategy. Cold data and discipline are your only salvation."
If you aren't willing to manage your risk, this dashboard won't save you. But if you have the discipline to read the numbers, plan your trade, and execute without hesitation, this tool will give you an unfair statistical advantage over the rest of the market.
Lock and load. Do your backtesting, execute your plan, and stop giving your money away to the market. Dismissed!

Wyłączenie odpowiedzialności
Informacje i publikacje nie stanowią i nie powinny być traktowane jako porady finansowe, inwestycyjne, tradingowe ani jakiekolwiek inne rekomendacje dostarczane lub zatwierdzone przez TradingView. Więcej informacji znajduje się w Warunkach użytkowania.
Wyłączenie odpowiedzialności
Informacje i publikacje nie stanowią i nie powinny być traktowane jako porady finansowe, inwestycyjne, tradingowe ani jakiekolwiek inne rekomendacje dostarczane lub zatwierdzone przez TradingView. Więcej informacji znajduje się w Warunkach użytkowania.