Hidden OB+
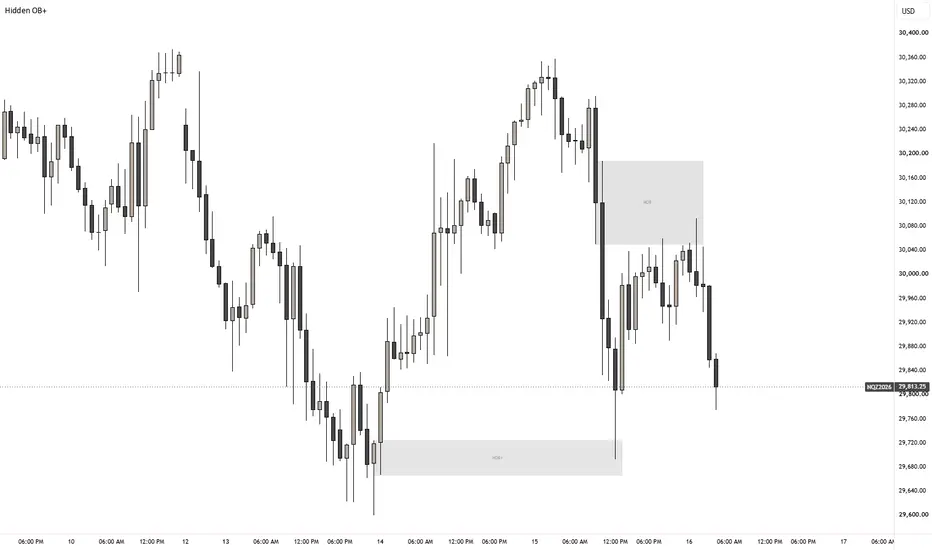
ICT HIDDEN OB+
Higher-Timeframe Wick-Overlap Zones
Marks potential hidden order block reference zones from two adjacent, completed candles on the selected Pattern Timeframe. The candles must move in the same direction and have overlapping opposing wicks.
Bullish zone: the older candle’s high to the newer candle’s low.
Bearish zone: the newer candle’s high to the older candle’s low.
The zone is identified at the start of the next Pattern Timeframe period, after both candles have closed.
DISPLAY OPTIONS
• Boundary Lines: minimal line display with Monochrome or Directional Colors.
• Filled Boxes: native filled zones with separate bullish and bearish background and border settings.
• Customize border style and width, horizontal extension, and optional box text.
• Show CE Line displays Consequent Encroachment at the zone midpoint in Filled Boxes mode.
SETTINGS
• Pattern Timeframe: timeframe used to identify the candle pair. The chart timeframe must be equal to or lower than this value.
• Historical Lookback: 1 Day, 1 Week, 1 Month, or Max, measured using New York time.
• Maximum Visible Zones: display limit; older zones are removed first.
• Bullish Zones and Bearish Zones: independently show or hide each direction.
• Line Color Scheme: Monochrome or Directional Colors for Boundary Lines mode.
• Bullish Box Style and Bearish Box Style: configure each direction’s background color, border, and box label text.
• Box Options: configure extension and optional text layout.
• Consequent Encroachment: configure CE visibility, color, style, and width.
ALERTS
• ICT Hidden OB+ — Long: a bullish wick-overlap pattern formed.
• ICT Hidden OB+ — Short: a bearish wick-overlap pattern formed.
Alerts report pattern formation only. They do not signal a zone touch, lower-timeframe confirmation, or trade entry.
LIMITATIONS
This indicator marks the higher-timeframe wick-overlap range only. It does not locate or verify the lower-timeframe order block, determine market bias, detect liquidity sweeps, or identify CISD/MSS. Those conditions must be assessed separately.
Zones are removed if price crosses their distal boundary. Use standard, time-based charts; non-standard chart types may produce synthetic OHLC values.
For educational and research use only. This indicator is not financial advice and does not guarantee any market outcome.
Higher-Timeframe Wick-Overlap Zones
Marks potential hidden order block reference zones from two adjacent, completed candles on the selected Pattern Timeframe. The candles must move in the same direction and have overlapping opposing wicks.
Bullish zone: the older candle’s high to the newer candle’s low.
Bearish zone: the newer candle’s high to the older candle’s low.
The zone is identified at the start of the next Pattern Timeframe period, after both candles have closed.
DISPLAY OPTIONS
• Boundary Lines: minimal line display with Monochrome or Directional Colors.
• Filled Boxes: native filled zones with separate bullish and bearish background and border settings.
• Customize border style and width, horizontal extension, and optional box text.
• Show CE Line displays Consequent Encroachment at the zone midpoint in Filled Boxes mode.
SETTINGS
• Pattern Timeframe: timeframe used to identify the candle pair. The chart timeframe must be equal to or lower than this value.
• Historical Lookback: 1 Day, 1 Week, 1 Month, or Max, measured using New York time.
• Maximum Visible Zones: display limit; older zones are removed first.
• Bullish Zones and Bearish Zones: independently show or hide each direction.
• Line Color Scheme: Monochrome or Directional Colors for Boundary Lines mode.
• Bullish Box Style and Bearish Box Style: configure each direction’s background color, border, and box label text.
• Box Options: configure extension and optional text layout.
• Consequent Encroachment: configure CE visibility, color, style, and width.
ALERTS
• ICT Hidden OB+ — Long: a bullish wick-overlap pattern formed.
• ICT Hidden OB+ — Short: a bearish wick-overlap pattern formed.
Alerts report pattern formation only. They do not signal a zone touch, lower-timeframe confirmation, or trade entry.
LIMITATIONS
This indicator marks the higher-timeframe wick-overlap range only. It does not locate or verify the lower-timeframe order block, determine market bias, detect liquidity sweeps, or identify CISD/MSS. Those conditions must be assessed separately.
Zones are removed if price crosses their distal boundary. Use standard, time-based charts; non-standard chart types may produce synthetic OHLC values.
For educational and research use only. This indicator is not financial advice and does not guarantee any market outcome.

Wyłączenie odpowiedzialności
Informacje i publikacje nie stanowią i nie powinny być traktowane jako porady finansowe, inwestycyjne, tradingowe ani jakiekolwiek inne rekomendacje dostarczane lub zatwierdzone przez TradingView. Więcej informacji znajduje się w Warunkach użytkowania.
Wyłączenie odpowiedzialności
Informacje i publikacje nie stanowią i nie powinny być traktowane jako porady finansowe, inwestycyjne, tradingowe ani jakiekolwiek inne rekomendacje dostarczane lub zatwierdzone przez TradingView. Więcej informacji znajduje się w Warunkach użytkowania.