OPEN-SOURCE SCRIPT
Zaktualizowano Dynamic Clean RSI Divergence (Regular & Hidden)
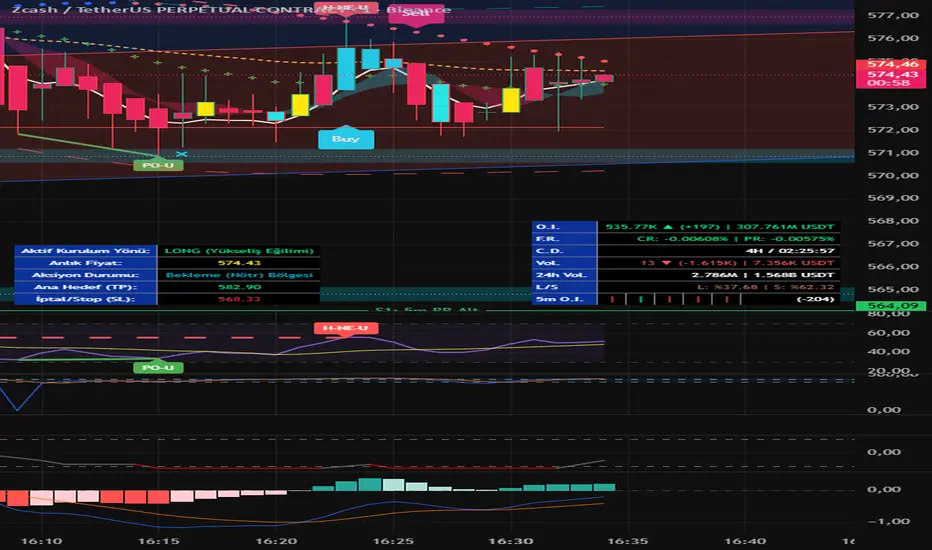
Most divergence indicators on TradingView clutter your screen by leaving every historical divergence line on the chart. This indicator is specifically designed for traders who prefer a minimalist and clean workspace. The Dynamic Clean RSI Divergence indicator scans the market dynamically and plots only the most recent valid divergences on your chart. Once a new divergence is confirmed, the old one is automatically removed, keeping your focus purely on the current price action.
It effectively detects both Regular and Hidden (Irregular) divergences using Pivot High/Low points and works flawlessly across all timeframes.
Key Features
Zero Chart Clutter: Only the last confirmed bullish and bearish divergence lines are kept on the screen.
Regular & Hidden Divergences: Scans for trend-reversal (regular) and trend-continuation (hidden) divergences simultaneously.
Visual Clarity: Uses distinct line styles and labels to instantly identify the type of divergence:
Bull (Solid Green Line): Regular Bullish Divergence
Bear (Solid Red Line): Regular Bearish Divergence
H-Bull (Dashed Green Line): Hidden Bullish Divergence
H-Bear (Dashed Red Line): Hidden Bearish Divergence
Fully Customizable: You can adjust the RSI Length, RSI Moving Average Length, and the Pivot Lookback (Left/Right bars) to fine-tune the sensitivity according to your trading strategy.
How to Set It Up (Important)
Due to TradingView’s standard limitations, a single indicator script cannot dynamically draw lines on both the main price chart and a separate lower oscillator pane at the same time. To achieve the perfect visual setup where divergences are connected on both the price action and the RSI oscillator, you need to apply the indicator twice.
Follow these exact steps:
Step 1: Apply to the Main Chart (Price Action)
Add the indicator to your chart.
By default, the settings are configured for the main chart. It will automatically draw the divergence lines connecting the highs and lows of the candlesticks.
Step 2: Apply to the Lower Pane (RSI View)
Add the exact same indicator to your chart a second time. It will temporarily overlay on top of your price chart.
Open the Settings of this second indicator.
Under the Inputs tab, find the "Çizim Yeri" (Drawing Location) setting and change it from "Grafik (Fiyat)" to "RSI Alt Penceresi".
Now, hover your mouse over the name of this second indicator in the top-left corner of your chart.
Click on the Three Dots (...) for the "More" menu.
Hover over "Move to" and select "New pane below".
Result: You will now have a beautifully synchronized setup with a fully styled RSI (Purple line, Yellow MA, and shaded 30-70 background) in the bottom pane, and divergence lines perfectly mirroring each other on both the price and the RSI!
It effectively detects both Regular and Hidden (Irregular) divergences using Pivot High/Low points and works flawlessly across all timeframes.
Key Features
Zero Chart Clutter: Only the last confirmed bullish and bearish divergence lines are kept on the screen.
Regular & Hidden Divergences: Scans for trend-reversal (regular) and trend-continuation (hidden) divergences simultaneously.
Visual Clarity: Uses distinct line styles and labels to instantly identify the type of divergence:
Bull (Solid Green Line): Regular Bullish Divergence
Bear (Solid Red Line): Regular Bearish Divergence
H-Bull (Dashed Green Line): Hidden Bullish Divergence
H-Bear (Dashed Red Line): Hidden Bearish Divergence
Fully Customizable: You can adjust the RSI Length, RSI Moving Average Length, and the Pivot Lookback (Left/Right bars) to fine-tune the sensitivity according to your trading strategy.
How to Set It Up (Important)
Due to TradingView’s standard limitations, a single indicator script cannot dynamically draw lines on both the main price chart and a separate lower oscillator pane at the same time. To achieve the perfect visual setup where divergences are connected on both the price action and the RSI oscillator, you need to apply the indicator twice.
Follow these exact steps:
Step 1: Apply to the Main Chart (Price Action)
Add the indicator to your chart.
By default, the settings are configured for the main chart. It will automatically draw the divergence lines connecting the highs and lows of the candlesticks.
Step 2: Apply to the Lower Pane (RSI View)
Add the exact same indicator to your chart a second time. It will temporarily overlay on top of your price chart.
Open the Settings of this second indicator.
Under the Inputs tab, find the "Çizim Yeri" (Drawing Location) setting and change it from "Grafik (Fiyat)" to "RSI Alt Penceresi".
Now, hover your mouse over the name of this second indicator in the top-left corner of your chart.
Click on the Three Dots (...) for the "More" menu.
Hover over "Move to" and select "New pane below".
Result: You will now have a beautifully synchronized setup with a fully styled RSI (Purple line, Yellow MA, and shaded 30-70 background) in the bottom pane, and divergence lines perfectly mirroring each other on both the price and the RSI!
Informacje o Wersji
Dynamic Clean RSI Divergence (Regular & Hidden) - Fully CustomizableOverview
Are you tired of divergence indicators that turn your charts into an unreadable mess of historical lines? The Dynamic Clean RSI Divergence indicator is designed specifically for traders who demand a minimalist, distraction-free workspace.
This script dynamically scans the market for both Regular and Hidden divergences. However, instead of leaving every past signal on your chart, it automatically deletes older lines and only displays the most recently confirmed divergences. Once a new divergence is detected, the old one is replaced, keeping your focus strictly on the current price action.
Key Features
Zero Chart Clutter: Only the latest confirmed bullish and bearish divergences are kept on the screen. No historical line graveyard.
Comprehensive Detection: Identifies both Regular (Trend-Reversal) and Hidden (Trend-Continuation) divergences using highly accurate Pivot points.
Fully Customizable UI: Every single visual element is under your control. Through the neatly organized settings menu, you can independently adjust the label text, line color, opacity, line width, and line style (Solid, Dashed, Dotted) for all four types of divergences (Regular Bull, Regular Bear, Hidden Bull, Hidden Bear).
Built-in Styled RSI: Comes with a visually appealing RSI oscillator complete with a customizable RSI Moving Average (MA) and a shaded 30-70 background zone.
How to Set It Up (Crucial Step for Dual-Drawing)
Due to standard TradingView limitations, a single script cannot dynamically draw lines on both the main price chart and a separate lower oscillator pane simultaneously. To achieve the perfect visual setup where divergence lines perfectly mirror each other on both the price action and the RSI, you need to apply this indicator twice.
Step 1: Apply to the Main Chart (Price Action)
Add the indicator to your chart.
By default, the Drawing Location setting is configured to "Main Chart (Price)". It will automatically draw the divergence lines connecting the highs and lows of the actual candlesticks.
Step 2: Apply to the Lower Pane (RSI View)
Add the exact same indicator to your chart a second time. (It will temporarily overlap your price chart).
Open the Settings of this second indicator.
Under the Inputs tab, find the "Drawing Location" setting and change it to "RSI Lower Pane".
Now, hover your mouse over the name of this second indicator in the top-left corner of your main chart.
Click on the Three Dots (...) to open the "More" menu.
Hover over "Move to" and select "New pane below".
Result: You now have a professional, fully synchronized setup. The customized RSI sits cleanly at the bottom of your screen, and the dynamic divergence lines update in real-time across both the price chart and the RSI pane without ever cluttering your workspace!
Informacje o Wersji
Dynamic Clean RSI Divergence (Regular & Hidden) - Fully CustomizableOverview
Are you tired of divergence indicators that turn your charts into an unreadable mess of historical lines? The Dynamic Clean RSI Divergence indicator is designed specifically for traders who demand a minimalist, distraction-free workspace.
This script dynamically scans the market for both Regular and Hidden divergences. However, instead of leaving every past signal on your chart, it automatically deletes older lines and only displays the most recently confirmed divergences. Once a new divergence is detected, the old one is replaced, keeping your focus strictly on the current price action.
Key Features
Zero Chart Clutter: Only the latest confirmed bullish and bearish divergences are kept on the screen. No historical line graveyard.
Comprehensive Detection: Identifies both Regular (Trend-Reversal) and Hidden (Trend-Continuation) divergences using highly accurate Pivot points.
Fully Customizable UI: Every single visual element is under your control. Through the neatly organized settings menu, you can independently adjust the label text, line color, opacity, line width, and line style (Solid, Dashed, Dotted) for all four types of divergences (Regular Bull, Regular Bear, Hidden Bull, Hidden Bear).
Built-in Styled RSI: Comes with a visually appealing RSI oscillator complete with a customizable RSI Moving Average (MA) and a shaded 30-70 background zone.
How to Set It Up (Crucial Step for Dual-Drawing)
Due to standard TradingView limitations, a single script cannot dynamically draw lines on both the main price chart and a separate lower oscillator pane simultaneously. To achieve the perfect visual setup where divergence lines perfectly mirror each other on both the price action and the RSI, you need to apply this indicator twice.
Step 1: Apply to the Main Chart (Price Action)
Add the indicator to your chart.
By default, the Drawing Location setting is configured to "Main Chart (Price)". It will automatically draw the divergence lines connecting the highs and lows of the actual candlesticks.
Step 2: Apply to the Lower Pane (RSI View)
Add the exact same indicator to your chart a second time. (It will temporarily overlap your price chart).
Open the Settings of this second indicator.
Under the Inputs tab, find the "Drawing Location" setting and change it to "RSI Lower Pane".
Now, hover your mouse over the name of this second indicator in the top-left corner of your main chart.
Click on the Three Dots (...) to open the "More" menu.
Hover over "Move to" and select "New pane below".
Result: You now have a professional, fully synchronized setup. The customized RSI sits cleanly at the bottom of your screen, and the dynamic divergence lines update in real-time across both the price chart and the RSI pane without ever cluttering your workspace!
Informacje o Wersji
Here is the updated, comprehensive, and professional English description tailored for the V3 version of your indicator. It covers all the visual features as well as a step-by-step guide for the new Telegram Webhook integration. You can copy and paste this directly into your TradingView publication page.Dynamic Clean RSI Divergence (Regular & Hidden) + Telegram Webhook Alerts
Overview
Are you tired of divergence indicators that turn your charts into an unreadable mess of historical lines? The Dynamic Clean RSI Divergence indicator is designed specifically for traders who demand a minimalist, distraction-free workspace with powerful automation capabilities.
This script dynamically scans the market for both Regular and Hidden divergences. Instead of leaving every past signal on your chart, it automatically deletes older lines and only displays the most recently confirmed divergences. Furthermore, this latest version includes a built-in Direct-to-Telegram Webhook Alert System, allowing you to send highly detailed divergence signals directly to your personal Telegram or specific Group Topics (Threads) without needing third-party bridge apps like Zapier.
Key Features
Zero Chart Clutter: Only the latest confirmed bullish and bearish divergences are kept on the screen. No historical line graveyard.
Comprehensive Detection: Identifies both Regular (Trend-Reversal) and Hidden (Trend-Continuation) divergences using highly accurate Pivot points.
Fully Customizable UI: Independently adjust the label text, line color, opacity, line width, and line style for all four types of divergences.
Built-in Styled RSI: Comes with a visually appealing RSI oscillator complete with a customizable RSI Moving Average (MA) and a shaded 30-70 background zone.
Advanced Telegram Automation: Native JSON payload generation for Telegram Webhooks, supporting both standard Chats/Groups and specific Forum Topics (Threads).
🛠️ Setup Guide Part 1: Visual Chart Setup (Crucial for Dual-Drawing)
Due to standard TradingView limitations, a single script cannot dynamically draw lines on both the main price chart and a separate lower oscillator pane simultaneously. To achieve the perfect visual setup where divergence lines mirror each other on both the price action and the RSI, you need to apply this indicator twice.
Step 1: Apply to the Main Chart (Price Action)
Add the indicator to your chart.
By default, the Drawing Location setting is configured to "Main Chart (Price)". It will automatically draw the divergence lines connecting the highs and lows of the candlesticks.
Step 2: Apply to the Lower Pane (RSI View)
Add the exact same indicator to your chart a second time. (It will temporarily overlap your price chart).
Open the Settings of this second indicator.
Under the Inputs tab, find the "Drawing Location" setting and change it to "RSI Lower Pane".
Hover your mouse over the name of this second indicator in the top-left corner of your main chart.
Click on the Three Dots (...) to open the "More" menu.
Hover over "Move to" and select "New pane below".
Result: You now have a synchronized setup. The customized RSI sits cleanly at the bottom, and the dynamic divergence lines update in real-time across both panes!
🚀 Setup Guide Part 2: Telegram Webhook Alerts Configuration
This indicator is hard-coded to send perfectly formatted JSON payloads to Telegram. Follow these steps to automate your trading signals:
1. Get Your Telegram Bot Info
Go to Telegram and search for @BotFather.
Type /newbot, follow the steps to create your bot, and copy the HTTP API Token (e.g., 123456789:ABCdefGhIJKlmNoPQR...).
Add your newly created bot to your Telegram Group and give it Admin privileges.
2. Configure the Indicator Settings
Open the Indicator Settings on TradingView.
Scroll down to the Alert Settings (Telegram Webhook) section.
Telegram Chat ID: Enter your Group or Personal Chat ID (e.g., -100123456789).
Telegram Topic (Thread) ID (Optional): If your group has "Topics/Forums" enabled and you want signals to go to a specific sub-topic, enter the Topic ID here (e.g., 15). If sending to a normal group or direct message, leave this blank.
Click OK to save the settings.
3. Create the TradingView Alert
Open the Create Alert menu in TradingView.
Condition: Select the "Dynamic Clean RSI Divergence" indicator. In the dropdown next to it, you MUST select "Any alert() function call". (Do not select crossing or other default conditions).
Go to the Notifications tab.
Check the Webhook URL box and paste the following URL, replacing <YOUR_BOT_TOKEN> with the token you got from BotFather:
api.telegram.org/bot<YOUR_BOT_TOKEN>/sendMessage
In the Message box at the bottom, simply type {{ticker}} (The actual formatted message is automatically generated by the indicator's code, but TradingView requires this box not to be empty).
Click Create.
You are all set! Your bot will now instantly notify your Telegram group whenever a confirmed Regular or Hidden divergence appears on the chart.
Informacje o Wersji
Dynamic Clean RSI Divergence (Regular & Hidden) + Telegram Webhook AlertsOverview
Are you tired of divergence indicators that turn your charts into an unreadable mess of historical lines? The Dynamic Clean RSI Divergence indicator is designed specifically for traders who demand a minimalist, distraction-free workspace with powerful automation capabilities.
This script dynamically scans the market for both Regular and Hidden divergences. Instead of leaving every past signal on your chart, it automatically deletes older lines and only displays the most recently confirmed divergences. Furthermore, this latest version includes a built-in Direct-to-Telegram Webhook Alert System, allowing you to send highly detailed divergence signals directly to your personal Telegram or specific Group Topics (Threads) without needing third-party bridge apps like Zapier.
Key Features
Zero Chart Clutter: Only the latest confirmed bullish and bearish divergences are kept on the screen. No historical line graveyard.
Comprehensive Detection: Identifies both Regular (Trend-Reversal) and Hidden (Trend-Continuation) divergences using highly accurate Pivot points.
Fully Customizable UI: Independently adjust the label text, line color, opacity, line width, and line style for all four types of divergences.
Built-in Styled RSI: Comes with a visually appealing RSI oscillator complete with a customizable RSI Moving Average (MA) and a shaded 30-70 background zone.
Advanced Telegram Automation: Native JSON payload generation for Telegram Webhooks, supporting both standard Chats/Groups and specific Forum Topics (Threads).
🛠️ Setup Guide Part 1: Visual Chart Setup (Crucial for Dual-Drawing)
Due to standard TradingView limitations, a single script cannot dynamically draw lines on both the main price chart and a separate lower oscillator pane simultaneously. To achieve the perfect visual setup where divergence lines mirror each other on both the price action and the RSI, you need to apply this indicator twice.
Step 1: Apply to the Main Chart (Price Action)
Add the indicator to your chart.
By default, the Drawing Location setting is configured to "Main Chart (Price)". It will automatically draw the divergence lines connecting the highs and lows of the candlesticks.
Step 2: Apply to the Lower Pane (RSI View)
Add the exact same indicator to your chart a second time. (It will temporarily overlap your price chart).
Open the Settings of this second indicator.
Under the Inputs tab, find the "Drawing Location" setting and change it to "RSI Lower Pane".
Hover your mouse over the name of this second indicator in the top-left corner of your main chart.
Click on the Three Dots (...) to open the "More" menu.
Hover over "Move to" and select "New pane below".
Result: You now have a synchronized setup. The customized RSI sits cleanly at the bottom, and the dynamic divergence lines update in real-time across both panes!
🚀 Setup Guide Part 2: Telegram Webhook Alerts Configuration
This indicator is hard-coded to send perfectly formatted JSON payloads to Telegram. Follow these steps to automate your trading signals:
1. Get Your Telegram Bot Info
Go to Telegram and search for @BotFather.
Type /newbot, follow the steps to create your bot, and copy the HTTP API Token (e.g., 123456789:ABCdefGhIJKlmNoPQR...).
Add your newly created bot to your Telegram Group and give it Admin privileges.
2. Configure the Indicator Settings
Open the Indicator Settings on TradingView.
Scroll down to the Alert Settings (Telegram Webhook) section.
Telegram Chat ID: Enter your Group or Personal Chat ID (e.g., -100123456789).
Telegram Topic (Thread) ID (Optional): If your group has "Topics/Forums" enabled and you want signals to go to a specific sub-topic, enter the Topic ID here (e.g., 15). If sending to a normal group or direct message, leave this blank.
Click OK to save the settings.
3. Create the TradingView Alert
Open the Create Alert menu in TradingView.
Condition: Select the "Dynamic Clean RSI Divergence" indicator. In the dropdown next to it, you MUST select "Any alert() function call". (Do not select crossing or other default conditions).
Go to the Notifications tab.
Check the Webhook URL box and paste the following URL, replacing <YOUR_BOT_TOKEN> with the token you got from BotFather:
api.telegram.org/bot<YOUR_BOT_TOKEN>/sendMessage
In the Message box at the bottom, simply type {{ticker}} (The actual formatted message is automatically generated by the indicator's code, but TradingView requires this box not to be empty).
Click Create.
You are all set! Your bot will now instantly notify your Telegram group whenever a confirmed Regular or Hidden divergence appears on the chart.
Informacje o Wersji
Dynamic Clean RSI Divergence (Regular & Hidden) + Telegram Webhook AlertsOverview
Are you tired of divergence indicators that turn your charts into an unreadable mess of historical lines? The Dynamic Clean RSI Divergence indicator is designed specifically for traders who demand a minimalist, distraction-free workspace with powerful automation capabilities.
This script dynamically scans the market for both Regular and Hidden divergences. Instead of leaving every past signal on your chart, it automatically deletes older lines and only displays the most recently confirmed divergences. Furthermore, this latest version includes a built-in Direct-to-Telegram Webhook Alert System, allowing you to send highly detailed divergence signals directly to your personal Telegram or specific Group Topics (Threads) without needing third-party bridge apps like Zapier.
Key Features
Zero Chart Clutter: Only the latest confirmed bullish and bearish divergences are kept on the screen. No historical line graveyard.
Comprehensive Detection: Identifies both Regular (Trend-Reversal) and Hidden (Trend-Continuation) divergences using highly accurate Pivot points.
Fully Customizable UI: Independently adjust the label text, line color, opacity, line width, and line style for all four types of divergences.
Built-in Styled RSI: Comes with a visually appealing RSI oscillator complete with a customizable RSI Moving Average (MA) and a shaded 30-70 background zone.
Advanced Telegram Automation: Native JSON payload generation for Telegram Webhooks, supporting both standard Chats/Groups and specific Forum Topics (Threads).
🛠️ Setup Guide Part 1: Visual Chart Setup (Crucial for Dual-Drawing)
Due to standard TradingView limitations, a single script cannot dynamically draw lines on both the main price chart and a separate lower oscillator pane simultaneously. To achieve the perfect visual setup where divergence lines mirror each other on both the price action and the RSI, you need to apply this indicator twice.
Step 1: Apply to the Main Chart (Price Action)
Add the indicator to your chart.
By default, the Drawing Location setting is configured to "Main Chart (Price)". It will automatically draw the divergence lines connecting the highs and lows of the candlesticks.
Step 2: Apply to the Lower Pane (RSI View)
Add the exact same indicator to your chart a second time. (It will temporarily overlap your price chart).
Open the Settings of this second indicator.
Under the Inputs tab, find the "Drawing Location" setting and change it to "RSI Lower Pane".
Hover your mouse over the name of this second indicator in the top-left corner of your main chart.
Click on the Three Dots (...) to open the "More" menu.
Hover over "Move to" and select "New pane below".
Result: You now have a synchronized setup. The customized RSI sits cleanly at the bottom, and the dynamic divergence lines update in real-time across both panes!
🚀 Setup Guide Part 2: Telegram Webhook Alerts Configuration
This indicator is hard-coded to send perfectly formatted JSON payloads to Telegram. Follow these steps to automate your trading signals:
1. Get Your Telegram Bot Info
Go to Telegram and search for @BotFather.
Type /newbot, follow the steps to create your bot, and copy the HTTP API Token (e.g., 123456789:ABCdefGhIJKlmNoPQR...).
Add your newly created bot to your Telegram Group and give it Admin privileges.
2. Configure the Indicator Settings
Open the Indicator Settings on TradingView.
Scroll down to the Alert Settings (Telegram Webhook) section.
Telegram Chat ID: Enter your Group or Personal Chat ID (e.g., -100123456789).
Telegram Topic (Thread) ID (Optional): If your group has "Topics/Forums" enabled and you want signals to go to a specific sub-topic, enter the Topic ID here (e.g., 15). If sending to a normal group or direct message, leave this blank.
Click OK to save the settings.
3. Create the TradingView Alert
Open the Create Alert menu in TradingView.
Condition: Select the "Dynamic Clean RSI Divergence" indicator. In the dropdown next to it, you MUST select "Any alert() function call". (Do not select crossing or other default conditions).
Go to the Notifications tab.
Check the Webhook URL box and paste the following URL, replacing <YOUR_BOT_TOKEN> with the token you got from BotFather:
api.telegram.org/bot<YOUR_BOT_TOKEN>/sendMessage
In the Message box at the bottom, simply type {{ticker}} (The actual formatted message is automatically generated by the indicator's code, but TradingView requires this box not to be empty).
Click Create.
You are all set! Your bot will now instantly notify your Telegram group whenever a confirmed Regular or Hidden divergence appears on the chart.
Skrypt open-source
W zgodzie z duchem TradingView twórca tego skryptu udostępnił go jako open-source, aby użytkownicy mogli przejrzeć i zweryfikować jego działanie. Ukłony dla autora. Korzystanie jest bezpłatne, jednak ponowna publikacja kodu podlega naszym Zasadom serwisu.

Wyłączenie odpowiedzialności
Informacje i publikacje nie stanowią i nie powinny być traktowane jako porady finansowe, inwestycyjne, tradingowe ani jakiekolwiek inne rekomendacje dostarczane lub zatwierdzone przez TradingView. Więcej informacji znajduje się w Warunkach użytkowania.
Skrypt open-source
W zgodzie z duchem TradingView twórca tego skryptu udostępnił go jako open-source, aby użytkownicy mogli przejrzeć i zweryfikować jego działanie. Ukłony dla autora. Korzystanie jest bezpłatne, jednak ponowna publikacja kodu podlega naszym Zasadom serwisu.
Wyłączenie odpowiedzialności
Informacje i publikacje nie stanowią i nie powinny być traktowane jako porady finansowe, inwestycyjne, tradingowe ani jakiekolwiek inne rekomendacje dostarczane lub zatwierdzone przez TradingView. Więcej informacji znajduje się w Warunkach użytkowania.