OPEN-SOURCE SCRIPT
RPFXBYDAN - Untouched Session Liquidity - Asia / London / NY
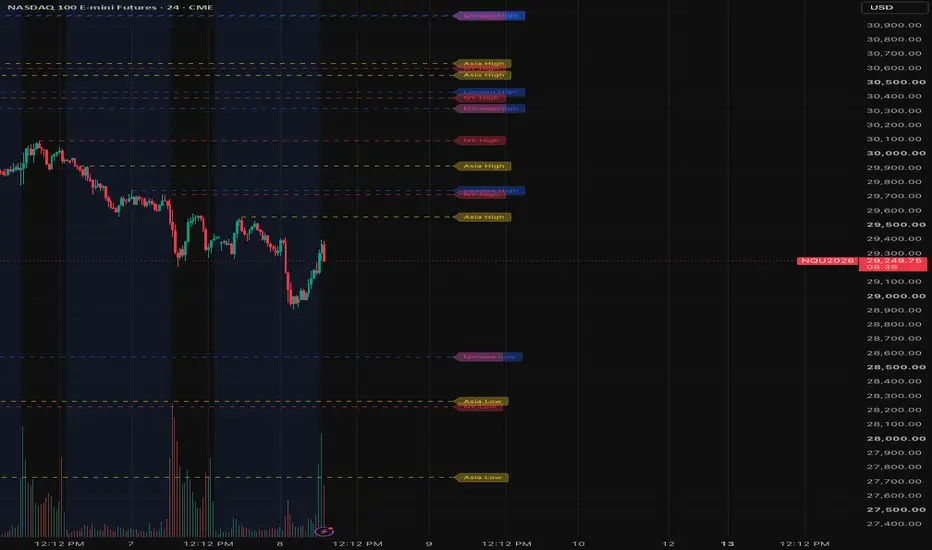
RPFXBYDAN - Untouched Session Liquidity — Asia / London / NY
**What this script does**
This indicator marks the high and low of each Asia, London, and New York trading session and projects those two levels forward as horizontal lines. Unlike a standard session-range indicator that leaves every past level on the chart, this one automatically deletes any level the moment price reaches it. The result is a running inventory of the recent session highs and lows that price has NOT yet run — the liquidity that is still "live" on the chart.
By default the script keeps the ten most recent sessions per region so you can see whether the current market is respecting, sweeping, or ignoring older session extremes.
**Why session highs and lows matter**
Session highs and lows tend to attract price because they collect a predictable pool of stop-loss orders — protective stops from participants who entered inside the previous session's range. Price often gravitates toward these levels, sweeps the liquidity, and reverses. Knowing which specific levels are still untaken (versus already mitigated) is more actionable than seeing every historical level indiscriminately, because only untaken levels still hold that liquidity.
**How the script works, step by step**
1. On every bar, the script checks whether the bar falls inside the Asia, London, or New York session window, using Pine's timezone-aware time function so detection is correct on any chart regardless of the user's timezone settings.
2. While a session is active, it tracks the running high and low and remembers the bar index at which each was set.
3. The instant a session closes (the first bar the session check flips from true to false), it draws two horizontal lines anchored at those bar indexes — one at the session high, one at the session low — with a text label naming the region.
4. Each new line and label is pushed onto a per-region array. If the array now holds more than the configured lookback count (default ten), the oldest entry is shifted off and deleted.
5. On every subsequent bar, the script walks the array of active lines and compares the current candle's high to each high level and the current candle's low to each low level. Any line whose level has been reached is deleted along with its label. Any line not yet touched has its right edge advanced so the projection stays anchored to the current bar.
The touch check is the mechanism that keeps the chart focused only on liquidity that hasn't been taken yet — it's what differentiates this from a normal "show previous session range" indicator.
**Timezone handling**
The default Auto mode detects each session in its own home timezone: Asia in Tokyo time, London in London time, and New York in New York time. Because Pine's time function accepts a timezone argument, the detection is correct regardless of what timezone your chart is set to, and daylight saving transitions are handled automatically. If you'd rather have all three sessions interpreted in one specific timezone (for example, always in your local one), the location dropdown lets you select from a menu of common cities and UTC offsets, and the session windows will be read in that timezone instead.
**Inputs**
- Your Location / Timezone — Auto (recommended) or a specific city / UTC offset
- Asia, London, New York Session windows — defaults calibrated to each session's home clock time
- Sessions to Keep — how many recent sessions per region to display (default 10)
- Colors per region, line width, line style, right-extension length, label toggle
**How to use it**
Add the indicator to a 5-minute, 15-minute, 30-minute, or 1-hour chart of any symbol. Give the chart a few days of history to load so the script can walk through session closes and populate the levels. Watch how price interacts with the untaken lines — a clean sweep of an old session high can precede a reversal, while price trading through a level without pausing suggests continuation. Because touched levels are removed automatically, whatever remains on the chart at any moment is the current "menu" of session liquidity worth watching.
Works on any instrument, though it's most useful on FX pairs, index futures, and crypto where session structure is meaningful. Higher timeframes (4H+) compress sessions into a single bar and reduce the value of the lines.
**Notes**
Session detection uses each session's home timezone in Auto mode; in manual mode you select a single timezone that applies to all three. Both modes automatically handle daylight saving.
**What this script does**
This indicator marks the high and low of each Asia, London, and New York trading session and projects those two levels forward as horizontal lines. Unlike a standard session-range indicator that leaves every past level on the chart, this one automatically deletes any level the moment price reaches it. The result is a running inventory of the recent session highs and lows that price has NOT yet run — the liquidity that is still "live" on the chart.
By default the script keeps the ten most recent sessions per region so you can see whether the current market is respecting, sweeping, or ignoring older session extremes.
**Why session highs and lows matter**
Session highs and lows tend to attract price because they collect a predictable pool of stop-loss orders — protective stops from participants who entered inside the previous session's range. Price often gravitates toward these levels, sweeps the liquidity, and reverses. Knowing which specific levels are still untaken (versus already mitigated) is more actionable than seeing every historical level indiscriminately, because only untaken levels still hold that liquidity.
**How the script works, step by step**
1. On every bar, the script checks whether the bar falls inside the Asia, London, or New York session window, using Pine's timezone-aware time function so detection is correct on any chart regardless of the user's timezone settings.
2. While a session is active, it tracks the running high and low and remembers the bar index at which each was set.
3. The instant a session closes (the first bar the session check flips from true to false), it draws two horizontal lines anchored at those bar indexes — one at the session high, one at the session low — with a text label naming the region.
4. Each new line and label is pushed onto a per-region array. If the array now holds more than the configured lookback count (default ten), the oldest entry is shifted off and deleted.
5. On every subsequent bar, the script walks the array of active lines and compares the current candle's high to each high level and the current candle's low to each low level. Any line whose level has been reached is deleted along with its label. Any line not yet touched has its right edge advanced so the projection stays anchored to the current bar.
The touch check is the mechanism that keeps the chart focused only on liquidity that hasn't been taken yet — it's what differentiates this from a normal "show previous session range" indicator.
**Timezone handling**
The default Auto mode detects each session in its own home timezone: Asia in Tokyo time, London in London time, and New York in New York time. Because Pine's time function accepts a timezone argument, the detection is correct regardless of what timezone your chart is set to, and daylight saving transitions are handled automatically. If you'd rather have all three sessions interpreted in one specific timezone (for example, always in your local one), the location dropdown lets you select from a menu of common cities and UTC offsets, and the session windows will be read in that timezone instead.
**Inputs**
- Your Location / Timezone — Auto (recommended) or a specific city / UTC offset
- Asia, London, New York Session windows — defaults calibrated to each session's home clock time
- Sessions to Keep — how many recent sessions per region to display (default 10)
- Colors per region, line width, line style, right-extension length, label toggle
**How to use it**
Add the indicator to a 5-minute, 15-minute, 30-minute, or 1-hour chart of any symbol. Give the chart a few days of history to load so the script can walk through session closes and populate the levels. Watch how price interacts with the untaken lines — a clean sweep of an old session high can precede a reversal, while price trading through a level without pausing suggests continuation. Because touched levels are removed automatically, whatever remains on the chart at any moment is the current "menu" of session liquidity worth watching.
Works on any instrument, though it's most useful on FX pairs, index futures, and crypto where session structure is meaningful. Higher timeframes (4H+) compress sessions into a single bar and reduce the value of the lines.
**Notes**
Session detection uses each session's home timezone in Auto mode; in manual mode you select a single timezone that applies to all three. Both modes automatically handle daylight saving.
Skrypt open-source
W zgodzie z duchem TradingView twórca tego skryptu udostępnił go jako open-source, aby użytkownicy mogli przejrzeć i zweryfikować jego działanie. Ukłony dla autora. Korzystanie jest bezpłatne, jednak ponowna publikacja kodu podlega naszym Zasadom serwisu.

Wyłączenie odpowiedzialności
Informacje i publikacje nie stanowią i nie powinny być traktowane jako porady finansowe, inwestycyjne, tradingowe ani jakiekolwiek inne rekomendacje dostarczane lub zatwierdzone przez TradingView. Więcej informacji znajduje się w Warunkach użytkowania.
Skrypt open-source
W zgodzie z duchem TradingView twórca tego skryptu udostępnił go jako open-source, aby użytkownicy mogli przejrzeć i zweryfikować jego działanie. Ukłony dla autora. Korzystanie jest bezpłatne, jednak ponowna publikacja kodu podlega naszym Zasadom serwisu.
Wyłączenie odpowiedzialności
Informacje i publikacje nie stanowią i nie powinny być traktowane jako porady finansowe, inwestycyjne, tradingowe ani jakiekolwiek inne rekomendacje dostarczane lub zatwierdzone przez TradingView. Więcej informacji znajduje się w Warunkach użytkowania.