Zaktualizowano
EDGE GLI Global Liquidity and Market Rotation
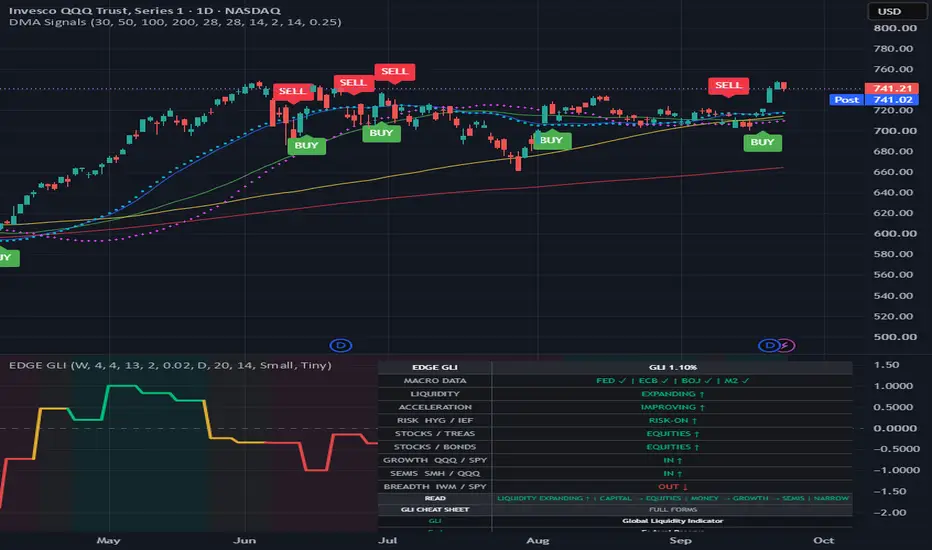
EDGE GLI — Global Liquidity & Market Rotation
EDGE GLI is a macro-liquidity and market-rotation indicator designed to answer two practical questions:
1. Is global liquidity becoming more supportive or less supportive for risk assets?
2. Where is capital currently being favored — equities, bonds, growth, semiconductors, or the broader market?
The indicator intentionally separates the slow macro-liquidity layer from the faster market-rotation layer.
This is useful because markets can continue rising even while liquidity is weakening, or semiconductors can continue outperforming even when overall market breadth is deteriorating.
--------------------------------------------------
GLOBAL LIQUIDITY — WEEKLY
--------------------------------------------------
The macro portion of EDGE GLI uses four liquidity inputs:
Fed = Federal Reserve balance sheet
ECB = European Central Bank balance sheet
BOJ = Bank of Japan balance sheet
M2 = U.S. Money Supply M2
ECB and BOJ data are adjusted through the relevant FX rates.
By default, EDGE GLI measures the percentage change in each component over approximately 4 weeks and averages the enabled components into the Global Liquidity Indicator.
Example:
GLI +0.40%
= Average liquidity impulse is approximately 0.40% higher than 4 weeks ago.
GLI -0.40%
= Average liquidity impulse is approximately 0.40% lower than 4 weeks ago.
The 0% line is an important reference point, but direction and acceleration matter as much as whether GLI is positive or negative.
--------------------------------------------------
LIQUIDITY REGIME
--------------------------------------------------
EXPANDING ↑
Liquidity impulse is positive and the faster GLI trend is above the slower trend.
CONTRACTING ↓
Liquidity impulse is negative and the faster GLI trend is below the slower trend.
IMPROVING ↗
Liquidity is not yet fully expanding, but the impulse is positive.
WEAKENING ↘
Liquidity is not yet fully confirmed as contracting, but the impulse is negative.
--------------------------------------------------
ACCELERATION
--------------------------------------------------
Liquidity level and liquidity acceleration are different.
Example:
LIQUIDITY: EXPANDING ↑
ACCELERATION: WEAKENING ↓
This means liquidity is still expanding, but it is expanding more slowly than before.
Think of it as:
The car is still moving forward, but the driver is easing off the accelerator.
--------------------------------------------------
MARKET ROTATION — DAILY
--------------------------------------------------
The rotation portion of EDGE GLI runs on daily data by default.
Each ratio uses:
EMA = Exponential Moving Average
ROC = Rate of Change
Default rotation logic:
IN / Risk-On
Ratio > EMA20 and ROC14 > 0
OUT / Risk-Off
Ratio < EMA20 and ROC14 < 0
NEUTRAL
Signals are mixed.
These ratios measure relative performance and rotation.
They do not measure literal dollar fund flows.
--------------------------------------------------
DASHBOARD CHEAT SHEET
--------------------------------------------------
HYG / IEF = Credit Risk Appetite
HYG = iShares iBoxx $ High Yield Corporate Bond ETF
IEF = iShares 7–10 Year Treasury Bond ETF
RISK-ON ↑
High-yield bonds are outperforming Treasuries.
Investors are showing greater willingness to take credit risk.
RISK-OFF ↓
Treasuries are outperforming high-yield bonds.
Investors are becoming more defensive.
--------------------------------------------------
SPY / IEF = Stocks vs Treasuries
SPY = SPDR S&P 500 ETF Trust
IEF = iShares 7–10 Year Treasury Bond ETF
EQUITIES ↑
Stocks are outperforming Treasuries.
TREASURIES ↑
Treasuries are outperforming stocks.
--------------------------------------------------
SPY / AGG = Stocks vs Broad Bonds
AGG = iShares Core U.S. Aggregate Bond ETF
EQUITIES ↑
Stocks are outperforming broad bonds.
BONDS ↑
Broad bonds are outperforming equities.
--------------------------------------------------
QQQ / SPY = Growth Rotation
QQQ = Invesco QQQ Trust
IN ↑
Growth and technology-heavy stocks are outperforming the broader market.
OUT ↓
Growth is losing relative strength.
--------------------------------------------------
SMH / QQQ = Semiconductor Rotation
SMH = VanEck Semiconductor ETF
IN ↑
Semiconductors are outperforming QQQ.
OUT ↓
Semiconductors are losing relative strength versus growth.
This is one of the most important signals for traders focused
--------------------------------------------------
IWM / SPY = Market Breadth
--------------------------------------------------
IWM = iShares Russell 2000 ETF
SPY = SPDR S&P 500 ETF Trust
IN ↑
Small-cap stocks are participating and the market advance is becoming broader.
OUT ↓
Small caps are lagging the broader market.
When IWM / SPY is OUT while QQQ / SPY and SMH / QQQ are IN, leadership is concentrated in fewer areas of the market.
EDGE GLI describes this as:
NARROW
A narrow market can still rise, but it is generally less broadly supported than one where small caps and the wider market are also participating.
--------------------------------------------------
HOW TO READ THE FINAL MESSAGE
--------------------------------------------------
The READ line combines the major layers into one plain-English summary.
Example:
LIQUIDITY EXPANDING ↑
CAPITAL → EQUITIES
MONEY → GROWTH → SEMIS
NARROW
This means:
- Global liquidity is still supportive.
- Equities are outperforming Treasuries and bonds.
- Growth is outperforming the broader stock market.
- Semiconductors are outperforming growth.
- Small caps are lagging, so participation is narrow.
Another example:
LIQUIDITY WEAKENING ↘
CAPITAL → BONDS / TREASURIES
MONEY → DEFENSIVE
NARROW
This means:
- Macro liquidity is becoming less supportive.
- Bonds and Treasuries are outperforming equities.
- Risk appetite is weakening.
- Market participation is narrow.
--------------------------------------------------
IMPORTANT DIVERGENCES TO WATCH
--------------------------------------------------
One of the main purposes of EDGE GLI is to identify situations where different layers disagree.
These divergences can be more useful than looking at price alone.
--------------------------------------------------
EXAMPLE 1:
SEMIS STRONG, LIQUIDITY WEAKENING
--------------------------------------------------
GLI = negative or weakening
QQQ / SPY = IN
SMH / QQQ = IN
Interpretation:
Growth and semiconductors are still leading, but they are doing so while the macro liquidity backdrop is becoming less supportive.
This does not mean semiconductors must immediately fall.
It means leadership is still intact, but the environment is becoming more fragile.
--------------------------------------------------
EXAMPLE 2:
SEMIS STRONG, BUT TREASURIES START WINNING
--------------------------------------------------
SMH / QQQ = IN
SPY / IEF = TREASURIES ↑
Interpretation:
Semiconductors may still be outperforming within equities, while Treasuries are beginning to outperform stocks overall.
This can be an early warning that investors are becoming more defensive even though semiconductor leadership has not yet broken.
--------------------------------------------------
EXAMPLE 3:
STRONG RISK-ON ENVIRONMENT
--------------------------------------------------
A broadly supportive configuration could look like:
LIQUIDITY = EXPANDING ↑
ACCELERATION = IMPROVING ↑
HYG / IEF = RISK-ON ↑
SPY / IEF = EQUITIES ↑
SPY / AGG = EQUITIES ↑
QQQ / SPY = IN ↑
SMH / QQQ = IN ↑
IWM / SPY = IN ↑
Interpretation:
- Liquidity is supportive.
- Liquidity momentum is improving.
- Credit markets are risk-on.
- Stocks are outperforming Treasuries.
- Stocks are outperforming broad bonds.
- Growth is leading.
- Semiconductors are leading growth.
- Small caps are also participating.
This is a much broader and healthier risk-on configuration.
--------------------------------------------------
EXAMPLE 4:
RISK-OFF ENVIRONMENT
--------------------------------------------------
A more defensive configuration could look like:
LIQUIDITY = CONTRACTING ↓
ACCELERATION = WEAKENING ↓
HYG / IEF = RISK-OFF ↓
SPY / IEF = TREASURIES ↑
SPY / AGG = BONDS ↑
QQQ / SPY = OUT ↓
SMH / QQQ = OUT ↓
IWM / SPY = OUT ↓
Interpretation:
- Liquidity is deteriorating.
- Credit markets are becoming defensive.
- Treasuries and bonds are outperforming stocks.
- Growth is losing leadership.
- Semiconductors are losing leadership.
- Market breadth is weak.
This represents a much more defensive market regime.
--------------------------------------------------
TIMEFRAMES
--------------------------------------------------
EDGE GLI intentionally uses two different speeds.
WEEKLY:
Used for the macro-liquidity layer.
This includes:
Fed
ECB
BOJ
M2
GLI
Liquidity regime
Liquidity acceleration
If TradingView shows:
EDGE GLI W
the W means Weekly.
DAILY:
Used for the market-rotation layer.
This includes:
HYG / IEF
SPY / IEF
SPY / AGG
QQQ / SPY
SMH / QQQ
IWM / SPY
The idea is simple:
Macro liquidity changes relatively slowly.
Market rotation can change much faster.
Using weekly macro data and daily rotation data allows EDGE GLI to monitor both.
--------------------------------------------------
DEFAULT SETTINGS
--------------------------------------------------
Liquidity timeframe:
Weekly
Liquidity impulse lookback:
4 periods
Fast GLI EMA:
4
Slow GLI EMA:
13
Acceleration smoothing:
2
Rotation timeframe:
Daily
Ratio EMA:
20
Ratio ROC:
14
The default settings are intentionally simple and are not heavily optimized.
The goal is to create a readable market-regime framework rather than an overfit trading system.
--------------------------------------------------
ABBREVIATION GUIDE
--------------------------------------------------
GLI = Global Liquidity Indicator
Fed = Federal Reserve
ECB = European Central Bank
BOJ = Bank of Japan
M2 = Money Supply M2
HYG = iShares iBoxx $ High Yield Corporate Bond ETF
IEF = iShares 7–10 Year Treasury Bond ETF
SPY = SPDR S&P 500 ETF Trust
AGG = iShares Core U.S. Aggregate Bond ETF
QQQ = Invesco QQQ Trust
SMH = VanEck Semiconductor ETF
IWM = iShares Russell 2000 ETF
ROC = Rate of Change
EMA = Exponential Moving Average
--------------------------------------------------
IMPORTANT LIMITATIONS
--------------------------------------------------
EDGE GLI does not measure literal dollar fund flows.
For example:
If SPY / IEF favors Treasuries, it means Treasuries are outperforming stocks.
It does NOT prove that a specific dollar amount moved directly from stocks into Treasuries.
Similarly:
NARROW does not necessarily mean retail or institutional investors have completely stopped participating.
It means market leadership is concentrated rather than broadly distributed.
Macro data also updates at different frequencies.
Some central-bank data updates weekly, while other series such as M2 or BOJ data may update more slowly.
Because of this, the GLI line can sometimes appear stair-stepped.
--------------------------------------------------
HOW TO USE EDGE GLI
--------------------------------------------------
EDGE GLI is best used as a market-regime and rotation framework.
It is not designed to be a stand-alone buy or sell signal.
The indicator is designed to help answer:
Is liquidity becoming more supportive or less supportive?
Are investors favoring risk or safety?
Are stocks outperforming bonds and Treasuries?
Is growth leading?
Are semiconductors leading growth?
Is the market advance broad or narrow?
The most useful information often comes from the relationship between these signals rather than from any single reading.
The core idea is:
LIQUIDITY
↓
ASSET ALLOCATION
↓
RISK APPETITE
↓
GROWTH
↓
SEMICONDUCTORS
↓
BREADTH
EDGE GLI helps visualize that chain in one place.
--------------------------------------------------
EDUCATIONAL USE ONLY
--------------------------------------------------
This indicator is provided for educational and informational purposes only.
It is not financial, investment, tax, or trading advice and should not be relied upon as a recommendation to buy, sell, or hold any security or financial instrument.
EDGE GLI is intended only as a framework for studying global liquidity, market rotation, relative strength, risk appetite, and market breadth.
All trading and investment decisions remain the responsibility of the individual user.
EDGE GLI is a macro-liquidity and market-rotation indicator designed to answer two practical questions:
1. Is global liquidity becoming more supportive or less supportive for risk assets?
2. Where is capital currently being favored — equities, bonds, growth, semiconductors, or the broader market?
The indicator intentionally separates the slow macro-liquidity layer from the faster market-rotation layer.
This is useful because markets can continue rising even while liquidity is weakening, or semiconductors can continue outperforming even when overall market breadth is deteriorating.
--------------------------------------------------
GLOBAL LIQUIDITY — WEEKLY
--------------------------------------------------
The macro portion of EDGE GLI uses four liquidity inputs:
Fed = Federal Reserve balance sheet
ECB = European Central Bank balance sheet
BOJ = Bank of Japan balance sheet
M2 = U.S. Money Supply M2
ECB and BOJ data are adjusted through the relevant FX rates.
By default, EDGE GLI measures the percentage change in each component over approximately 4 weeks and averages the enabled components into the Global Liquidity Indicator.
Example:
GLI +0.40%
= Average liquidity impulse is approximately 0.40% higher than 4 weeks ago.
GLI -0.40%
= Average liquidity impulse is approximately 0.40% lower than 4 weeks ago.
The 0% line is an important reference point, but direction and acceleration matter as much as whether GLI is positive or negative.
--------------------------------------------------
LIQUIDITY REGIME
--------------------------------------------------
EXPANDING ↑
Liquidity impulse is positive and the faster GLI trend is above the slower trend.
CONTRACTING ↓
Liquidity impulse is negative and the faster GLI trend is below the slower trend.
IMPROVING ↗
Liquidity is not yet fully expanding, but the impulse is positive.
WEAKENING ↘
Liquidity is not yet fully confirmed as contracting, but the impulse is negative.
--------------------------------------------------
ACCELERATION
--------------------------------------------------
Liquidity level and liquidity acceleration are different.
Example:
LIQUIDITY: EXPANDING ↑
ACCELERATION: WEAKENING ↓
This means liquidity is still expanding, but it is expanding more slowly than before.
Think of it as:
The car is still moving forward, but the driver is easing off the accelerator.
--------------------------------------------------
MARKET ROTATION — DAILY
--------------------------------------------------
The rotation portion of EDGE GLI runs on daily data by default.
Each ratio uses:
EMA = Exponential Moving Average
ROC = Rate of Change
Default rotation logic:
IN / Risk-On
Ratio > EMA20 and ROC14 > 0
OUT / Risk-Off
Ratio < EMA20 and ROC14 < 0
NEUTRAL
Signals are mixed.
These ratios measure relative performance and rotation.
They do not measure literal dollar fund flows.
--------------------------------------------------
DASHBOARD CHEAT SHEET
--------------------------------------------------
HYG / IEF = Credit Risk Appetite
HYG = iShares iBoxx $ High Yield Corporate Bond ETF
IEF = iShares 7–10 Year Treasury Bond ETF
RISK-ON ↑
High-yield bonds are outperforming Treasuries.
Investors are showing greater willingness to take credit risk.
RISK-OFF ↓
Treasuries are outperforming high-yield bonds.
Investors are becoming more defensive.
--------------------------------------------------
SPY / IEF = Stocks vs Treasuries
SPY = SPDR S&P 500 ETF Trust
IEF = iShares 7–10 Year Treasury Bond ETF
EQUITIES ↑
Stocks are outperforming Treasuries.
TREASURIES ↑
Treasuries are outperforming stocks.
--------------------------------------------------
SPY / AGG = Stocks vs Broad Bonds
AGG = iShares Core U.S. Aggregate Bond ETF
EQUITIES ↑
Stocks are outperforming broad bonds.
BONDS ↑
Broad bonds are outperforming equities.
--------------------------------------------------
QQQ / SPY = Growth Rotation
QQQ = Invesco QQQ Trust
IN ↑
Growth and technology-heavy stocks are outperforming the broader market.
OUT ↓
Growth is losing relative strength.
--------------------------------------------------
SMH / QQQ = Semiconductor Rotation
SMH = VanEck Semiconductor ETF
IN ↑
Semiconductors are outperforming QQQ.
OUT ↓
Semiconductors are losing relative strength versus growth.
This is one of the most important signals for traders focused
--------------------------------------------------
IWM / SPY = Market Breadth
--------------------------------------------------
IWM = iShares Russell 2000 ETF
SPY = SPDR S&P 500 ETF Trust
IN ↑
Small-cap stocks are participating and the market advance is becoming broader.
OUT ↓
Small caps are lagging the broader market.
When IWM / SPY is OUT while QQQ / SPY and SMH / QQQ are IN, leadership is concentrated in fewer areas of the market.
EDGE GLI describes this as:
NARROW
A narrow market can still rise, but it is generally less broadly supported than one where small caps and the wider market are also participating.
--------------------------------------------------
HOW TO READ THE FINAL MESSAGE
--------------------------------------------------
The READ line combines the major layers into one plain-English summary.
Example:
LIQUIDITY EXPANDING ↑
CAPITAL → EQUITIES
MONEY → GROWTH → SEMIS
NARROW
This means:
- Global liquidity is still supportive.
- Equities are outperforming Treasuries and bonds.
- Growth is outperforming the broader stock market.
- Semiconductors are outperforming growth.
- Small caps are lagging, so participation is narrow.
Another example:
LIQUIDITY WEAKENING ↘
CAPITAL → BONDS / TREASURIES
MONEY → DEFENSIVE
NARROW
This means:
- Macro liquidity is becoming less supportive.
- Bonds and Treasuries are outperforming equities.
- Risk appetite is weakening.
- Market participation is narrow.
--------------------------------------------------
IMPORTANT DIVERGENCES TO WATCH
--------------------------------------------------
One of the main purposes of EDGE GLI is to identify situations where different layers disagree.
These divergences can be more useful than looking at price alone.
--------------------------------------------------
EXAMPLE 1:
SEMIS STRONG, LIQUIDITY WEAKENING
--------------------------------------------------
GLI = negative or weakening
QQQ / SPY = IN
SMH / QQQ = IN
Interpretation:
Growth and semiconductors are still leading, but they are doing so while the macro liquidity backdrop is becoming less supportive.
This does not mean semiconductors must immediately fall.
It means leadership is still intact, but the environment is becoming more fragile.
--------------------------------------------------
EXAMPLE 2:
SEMIS STRONG, BUT TREASURIES START WINNING
--------------------------------------------------
SMH / QQQ = IN
SPY / IEF = TREASURIES ↑
Interpretation:
Semiconductors may still be outperforming within equities, while Treasuries are beginning to outperform stocks overall.
This can be an early warning that investors are becoming more defensive even though semiconductor leadership has not yet broken.
--------------------------------------------------
EXAMPLE 3:
STRONG RISK-ON ENVIRONMENT
--------------------------------------------------
A broadly supportive configuration could look like:
LIQUIDITY = EXPANDING ↑
ACCELERATION = IMPROVING ↑
HYG / IEF = RISK-ON ↑
SPY / IEF = EQUITIES ↑
SPY / AGG = EQUITIES ↑
QQQ / SPY = IN ↑
SMH / QQQ = IN ↑
IWM / SPY = IN ↑
Interpretation:
- Liquidity is supportive.
- Liquidity momentum is improving.
- Credit markets are risk-on.
- Stocks are outperforming Treasuries.
- Stocks are outperforming broad bonds.
- Growth is leading.
- Semiconductors are leading growth.
- Small caps are also participating.
This is a much broader and healthier risk-on configuration.
--------------------------------------------------
EXAMPLE 4:
RISK-OFF ENVIRONMENT
--------------------------------------------------
A more defensive configuration could look like:
LIQUIDITY = CONTRACTING ↓
ACCELERATION = WEAKENING ↓
HYG / IEF = RISK-OFF ↓
SPY / IEF = TREASURIES ↑
SPY / AGG = BONDS ↑
QQQ / SPY = OUT ↓
SMH / QQQ = OUT ↓
IWM / SPY = OUT ↓
Interpretation:
- Liquidity is deteriorating.
- Credit markets are becoming defensive.
- Treasuries and bonds are outperforming stocks.
- Growth is losing leadership.
- Semiconductors are losing leadership.
- Market breadth is weak.
This represents a much more defensive market regime.
--------------------------------------------------
TIMEFRAMES
--------------------------------------------------
EDGE GLI intentionally uses two different speeds.
WEEKLY:
Used for the macro-liquidity layer.
This includes:
Fed
ECB
BOJ
M2
GLI
Liquidity regime
Liquidity acceleration
If TradingView shows:
EDGE GLI W
the W means Weekly.
DAILY:
Used for the market-rotation layer.
This includes:
HYG / IEF
SPY / IEF
SPY / AGG
QQQ / SPY
SMH / QQQ
IWM / SPY
The idea is simple:
Macro liquidity changes relatively slowly.
Market rotation can change much faster.
Using weekly macro data and daily rotation data allows EDGE GLI to monitor both.
--------------------------------------------------
DEFAULT SETTINGS
--------------------------------------------------
Liquidity timeframe:
Weekly
Liquidity impulse lookback:
4 periods
Fast GLI EMA:
4
Slow GLI EMA:
13
Acceleration smoothing:
2
Rotation timeframe:
Daily
Ratio EMA:
20
Ratio ROC:
14
The default settings are intentionally simple and are not heavily optimized.
The goal is to create a readable market-regime framework rather than an overfit trading system.
--------------------------------------------------
ABBREVIATION GUIDE
--------------------------------------------------
GLI = Global Liquidity Indicator
Fed = Federal Reserve
ECB = European Central Bank
BOJ = Bank of Japan
M2 = Money Supply M2
HYG = iShares iBoxx $ High Yield Corporate Bond ETF
IEF = iShares 7–10 Year Treasury Bond ETF
SPY = SPDR S&P 500 ETF Trust
AGG = iShares Core U.S. Aggregate Bond ETF
QQQ = Invesco QQQ Trust
SMH = VanEck Semiconductor ETF
IWM = iShares Russell 2000 ETF
ROC = Rate of Change
EMA = Exponential Moving Average
--------------------------------------------------
IMPORTANT LIMITATIONS
--------------------------------------------------
EDGE GLI does not measure literal dollar fund flows.
For example:
If SPY / IEF favors Treasuries, it means Treasuries are outperforming stocks.
It does NOT prove that a specific dollar amount moved directly from stocks into Treasuries.
Similarly:
NARROW does not necessarily mean retail or institutional investors have completely stopped participating.
It means market leadership is concentrated rather than broadly distributed.
Macro data also updates at different frequencies.
Some central-bank data updates weekly, while other series such as M2 or BOJ data may update more slowly.
Because of this, the GLI line can sometimes appear stair-stepped.
--------------------------------------------------
HOW TO USE EDGE GLI
--------------------------------------------------
EDGE GLI is best used as a market-regime and rotation framework.
It is not designed to be a stand-alone buy or sell signal.
The indicator is designed to help answer:
Is liquidity becoming more supportive or less supportive?
Are investors favoring risk or safety?
Are stocks outperforming bonds and Treasuries?
Is growth leading?
Are semiconductors leading growth?
Is the market advance broad or narrow?
The most useful information often comes from the relationship between these signals rather than from any single reading.
The core idea is:
LIQUIDITY
↓
ASSET ALLOCATION
↓
RISK APPETITE
↓
GROWTH
↓
SEMICONDUCTORS
↓
BREADTH
EDGE GLI helps visualize that chain in one place.
--------------------------------------------------
EDUCATIONAL USE ONLY
--------------------------------------------------
This indicator is provided for educational and informational purposes only.
It is not financial, investment, tax, or trading advice and should not be relied upon as a recommendation to buy, sell, or hold any security or financial instrument.
EDGE GLI is intended only as a framework for studying global liquidity, market rotation, relative strength, risk appetite, and market breadth.
All trading and investment decisions remain the responsibility of the individual user.
Informacje o Wersji
Improved the Liquidity Impulse Lookback setting with clearer guidance on how shorter and longer lookback periods affect GLI sensitivity. No change to the underlying logic.
Wyłączenie odpowiedzialności
Informacje i publikacje nie stanowią i nie powinny być traktowane jako porady finansowe, inwestycyjne, tradingowe ani jakiekolwiek inne rekomendacje dostarczane lub zatwierdzone przez TradingView. Więcej informacji znajduje się w Warunkach użytkowania.
Wyłączenie odpowiedzialności
Informacje i publikacje nie stanowią i nie powinny być traktowane jako porady finansowe, inwestycyjne, tradingowe ani jakiekolwiek inne rekomendacje dostarczane lub zatwierdzone przez TradingView. Więcej informacji znajduje się w Warunkach użytkowania.