Zaktualizowano
Fragility-Weighted Liquidity Map Kyle Amihud Roll
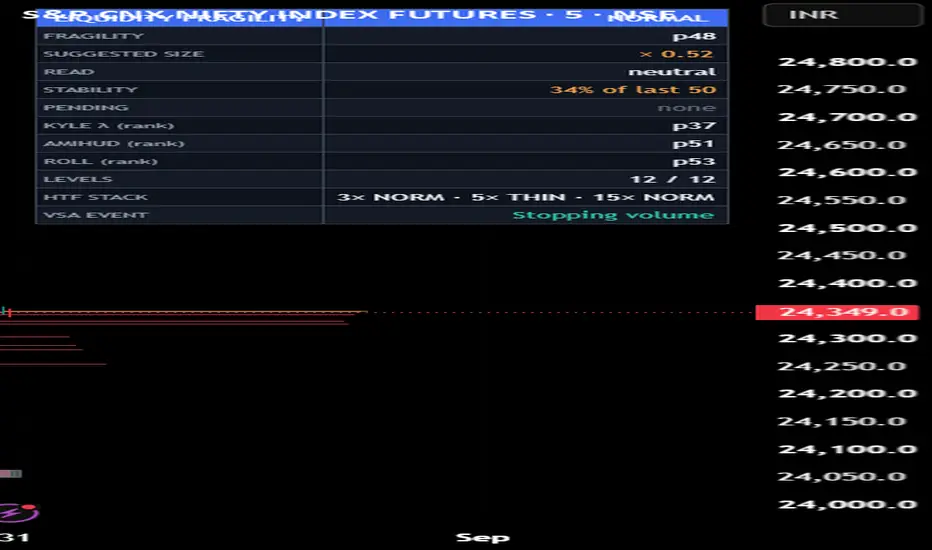
Fragility-Weighted Liquidity Map — Kyle · Amihud · Roll
What it is
A move of the same size means opposite things depending on the book beneath it. Into a thin book, a move is mostly price impact — mechanical, fragile, prone to snap back. Into a deep book, the same move took real participation and is more likely informed. This tool estimates how impact-driven the tape is right now from three classic microstructure measures, fuses them into one fragility read, and tints recent liquidity levels by it. It scales conviction and risk — it never picks a direction.
The three measures (all from OHLCV, peer-reviewed)
Kyle's lambda (Kyle 1985) — price impact per unit of signed volume: |price change over a window| ÷ |Σ sign(Δclose)·volume|. High λ = each unit of flow moves price a lot = thin, impactable.
Amihud illiquidity (Amihud 2002) — the average of |return| ÷ dollar-volume. High = small volume moves price a lot. (Empirically ~0.8 correlated with Kyle, so the two are blended, not double-counted.)
Roll implied spread (Roll 1984) — the effective spread implied by the bid-ask bounce: c = 2·√(−Cov(Δp, Δp₋₁)) when that covariance is negative. When it is positive — common in trends — the Roll model does not apply, so the estimate is shown as not measurable here rather than forced to a number. That honesty is deliberate.
Fusion → fragility
Each measure is ranked against its own recent history (a percentile), so the read self-tunes to the symbol and timeframe. The fragility index is the weighted blend of whichever measures are currently available (Roll drops out in trends, and the blend adapts). High fragility = impact-driven, reversible tape; low = deep, informed. A plain-language read suggests trusting breakouts less and fades more when fragility is high — as context, not a signal.
The map
Bars that trade unusually large volume leave a horizontal liquidity level where size changed hands. Each level is tinted by the fragility state at the moment it formed: warm = it printed in a thin/impact-driven tape (a weaker level, more likely to be swept); cool = it printed in a deep/informed tape (sturdier). So the map shows not just where liquidity sits but how trustworthy each pocket is.
How to use it
Add to any liquid symbol/timeframe; defaults suit index futures — change the price/volume sources for other markets.
Glance at the fragility lane — the thin strip at the pane bottom: red = thin/fragile, green = deep/solid, gray = normal. Risk-semantic colors (danger/safe), never direction. That strip alone answers "how careful should I be" for a non-technical user.
States are dwell-filtered (standard anti-chattering): a new THIN/DEEP/NORMAL is announced only after surviving a set number of bars, so the read doesn't flip-flop. STABILITY shows how settled it is; PENDING shows a forming state with a countdown. The cost is a few bars of lag — stated and adjustable.
The HTF STACK row shows the raw fragility state on three higher timeframes derived as multiples of the chart (defaults 3×, 5×, 15× — a 5m chart reads 15m/25m/75m automatically). ✓ green = all timeframes agree on the same actionable state; ⚠ amber = a higher timeframe reads the opposite state.
Read the dashboard: DEEP / NORMAL / THIN, the three measures' ranks, and a suggested size factor. As it turns THIN, treat moves as more reversible: size down, favour fades over breakout-chasing.
Use the rails as liquidity references coloured by trust — a warm rail formed in fragile conditions; a cool rail in solid ones.
Pairs with Order-Flow Criticality: that tool asks whether flow is self-exciting (endogenous); this asks whether the book is thin (impactable). Both elevated together is the genuinely fragile state.
What makes it original
Retail liquidity tools draw where volume traded. This one weights each level and the whole tape by how impactable it is, using three peer-reviewed microstructure estimators computed from bar data, self-calibrated, and — crucially — honest about when the Roll model doesn't apply. Reframing a liquidity map from "where is liquidity" to "how fragile is liquidity" is the contribution.
Concept credits
Price impact of order flow (lambda) — A. S. Kyle (1985). Illiquidity ratio — Y. Amihud (2002). Implied effective spread from serial covariance — R. Roll (1984). Square-root impact refinement — J. Hasbrouck. Fragility framing — general market-microstructure literature. Implementation and charting design are the author's own.
Important disclaimer
Research and education only. Not financial advice, not a signal service, not a guarantee of future results. These are proxies estimated from bar data, not order-book truth, and they do not predict direction. Validate independently and manage your own risk.
What it is
A move of the same size means opposite things depending on the book beneath it. Into a thin book, a move is mostly price impact — mechanical, fragile, prone to snap back. Into a deep book, the same move took real participation and is more likely informed. This tool estimates how impact-driven the tape is right now from three classic microstructure measures, fuses them into one fragility read, and tints recent liquidity levels by it. It scales conviction and risk — it never picks a direction.
The three measures (all from OHLCV, peer-reviewed)
Kyle's lambda (Kyle 1985) — price impact per unit of signed volume: |price change over a window| ÷ |Σ sign(Δclose)·volume|. High λ = each unit of flow moves price a lot = thin, impactable.
Amihud illiquidity (Amihud 2002) — the average of |return| ÷ dollar-volume. High = small volume moves price a lot. (Empirically ~0.8 correlated with Kyle, so the two are blended, not double-counted.)
Roll implied spread (Roll 1984) — the effective spread implied by the bid-ask bounce: c = 2·√(−Cov(Δp, Δp₋₁)) when that covariance is negative. When it is positive — common in trends — the Roll model does not apply, so the estimate is shown as not measurable here rather than forced to a number. That honesty is deliberate.
Fusion → fragility
Each measure is ranked against its own recent history (a percentile), so the read self-tunes to the symbol and timeframe. The fragility index is the weighted blend of whichever measures are currently available (Roll drops out in trends, and the blend adapts). High fragility = impact-driven, reversible tape; low = deep, informed. A plain-language read suggests trusting breakouts less and fades more when fragility is high — as context, not a signal.
The map
Bars that trade unusually large volume leave a horizontal liquidity level where size changed hands. Each level is tinted by the fragility state at the moment it formed: warm = it printed in a thin/impact-driven tape (a weaker level, more likely to be swept); cool = it printed in a deep/informed tape (sturdier). So the map shows not just where liquidity sits but how trustworthy each pocket is.
How to use it
Add to any liquid symbol/timeframe; defaults suit index futures — change the price/volume sources for other markets.
Glance at the fragility lane — the thin strip at the pane bottom: red = thin/fragile, green = deep/solid, gray = normal. Risk-semantic colors (danger/safe), never direction. That strip alone answers "how careful should I be" for a non-technical user.
States are dwell-filtered (standard anti-chattering): a new THIN/DEEP/NORMAL is announced only after surviving a set number of bars, so the read doesn't flip-flop. STABILITY shows how settled it is; PENDING shows a forming state with a countdown. The cost is a few bars of lag — stated and adjustable.
The HTF STACK row shows the raw fragility state on three higher timeframes derived as multiples of the chart (defaults 3×, 5×, 15× — a 5m chart reads 15m/25m/75m automatically). ✓ green = all timeframes agree on the same actionable state; ⚠ amber = a higher timeframe reads the opposite state.
Read the dashboard: DEEP / NORMAL / THIN, the three measures' ranks, and a suggested size factor. As it turns THIN, treat moves as more reversible: size down, favour fades over breakout-chasing.
Use the rails as liquidity references coloured by trust — a warm rail formed in fragile conditions; a cool rail in solid ones.
Pairs with Order-Flow Criticality: that tool asks whether flow is self-exciting (endogenous); this asks whether the book is thin (impactable). Both elevated together is the genuinely fragile state.
What makes it original
Retail liquidity tools draw where volume traded. This one weights each level and the whole tape by how impactable it is, using three peer-reviewed microstructure estimators computed from bar data, self-calibrated, and — crucially — honest about when the Roll model doesn't apply. Reframing a liquidity map from "where is liquidity" to "how fragile is liquidity" is the contribution.
Concept credits
Price impact of order flow (lambda) — A. S. Kyle (1985). Illiquidity ratio — Y. Amihud (2002). Implied effective spread from serial covariance — R. Roll (1984). Square-root impact refinement — J. Hasbrouck. Fragility framing — general market-microstructure literature. Implementation and charting design are the author's own.
Important disclaimer
Research and education only. Not financial advice, not a signal service, not a guarantee of future results. These are proxies estimated from bar data, not order-book truth, and they do not predict direction. Validate independently and manage your own risk.
Informacje o Wersji
v1.1 — Finishing pass (no engine change)- Cleared a Pine warning (CW10004): the fragility index called ta.ema from inside a "skip while
warming up" check (chart and higher-timeframe). It now runs every bar via a seed-on-first-valid
EMA that reproduces the exact same output after warm-up — only the warning is gone.
- Added a Data Window (EXP_) export bus so the fragility index, its Kyle/Amihud/Roll component ranks
and the liquidity state can feed other scripts via input.source().
- Added the MPL-2.0 licence header.
- No change to the Kyle/Amihud/Roll engine, the liquidity state, the level marking, the
multi-timeframe reads or the dashboard — everyday behaviour is identical.
Descriptive liquidity/risk-mapping tool, not investment advice.
Informacje o Wersji
v1.2 — Three additive layers: a fitted price-impact coefficient, true measured intrabar flow, and named VSA bar events. The Amihud and Roll estimators, the percentile fusion, the dwell-debounce, the liquidity map and the multi-timeframe stack are all unchanged (set Kyle method = "Ratio (original)" and Flow sign source = "Bar return sign" to reproduce the exact v1.1 read).1. Kyle's lambda as a rolling OLS slope (default on) v1.1 measured price impact with the classic aggregate ratio — |Σ price change| / |Σ signed volume| over the window. This adds the option to fit it properly instead: the regression slope of Δprice on signed flow, λ = cov(Δp, flow) / var(flow) — an actual impact coefficient rather than a ratio of sums, which is closer to Kyle's original formulation and less sensitive to a single large bar. Selectable via "Kyle method"; set it to "Ratio (original)" for the v1.1 number.
2. True measured intrabar flow (default on) The signed volume fed to Kyle can now be measured rather than assumed. Instead of sign(bar return) × volume, it sums lower-timeframe sub-bars — each signed by close-vs-open — into actual net intrabar delta, and falls back automatically to the bar-return sign on bars with no sub-bar data or on higher timeframes. Selectable via "Flow sign source"; set it to "Bar return sign" for the v1.1 behaviour.
3. VSA bar events The map now also names the current bar's dominant Wyckoff / effort-vs-result event — Upthrust, Shakeout, Stopping Volume, Buying/Selling Climax, No-Demand/No-Supply — on a new "VSA event" dashboard row and as EXP_VSABias (+1 bullish / −1 bearish / 0). This gives you the bar character alongside the fragility read — e.g. a size print forming on a Stopping-Volume bar in a thin tape is a different level from one on a Buying Climax. Optional on-price markers are included but off by default (keeps the published chart clean).
What is unchanged. The Amihud illiquidity ratio, the Roll implied-spread covariance (still returned as "not measurable" in trends rather than forced to zero), the per-measure percentile self-calibration, the weighted fusion of available ranks, the seed-on-first-valid EMA, the minimum-dwell state debounce, the liquidity-level map and the three-timeframe HTF stack are all byte-for-byte v1.1. The three new layers only read price/volume and bar data; none feeds back into the fragility engine or the calibration.
Still a descriptive liquidity/risk map, not a signal — it scales conviction and risk, it never picks a direction. These are proxies estimated from bar data, not order-book truth. Non-repaint: all measures, ranks, states and levels resolve on confirmed bars; the live bar is provisional. Concept credits unchanged (Kyle 1985 price impact; Amihud 2002 illiquidity; Roll 1984 implied spread; Hasbrouck square-root refinement; VSA is the standard Wyckoff vocabulary).

Wyłączenie odpowiedzialności
Informacje i publikacje nie stanowią i nie powinny być traktowane jako porady finansowe, inwestycyjne, tradingowe ani jakiekolwiek inne rekomendacje dostarczane lub zatwierdzone przez TradingView. Więcej informacji znajduje się w Warunkach użytkowania.
Wyłączenie odpowiedzialności
Informacje i publikacje nie stanowią i nie powinny być traktowane jako porady finansowe, inwestycyjne, tradingowe ani jakiekolwiek inne rekomendacje dostarczane lub zatwierdzone przez TradingView. Więcej informacji znajduje się w Warunkach użytkowania.