OPEN-SOURCE SCRIPT
Volumetric Trend Structure [BOSWaves]
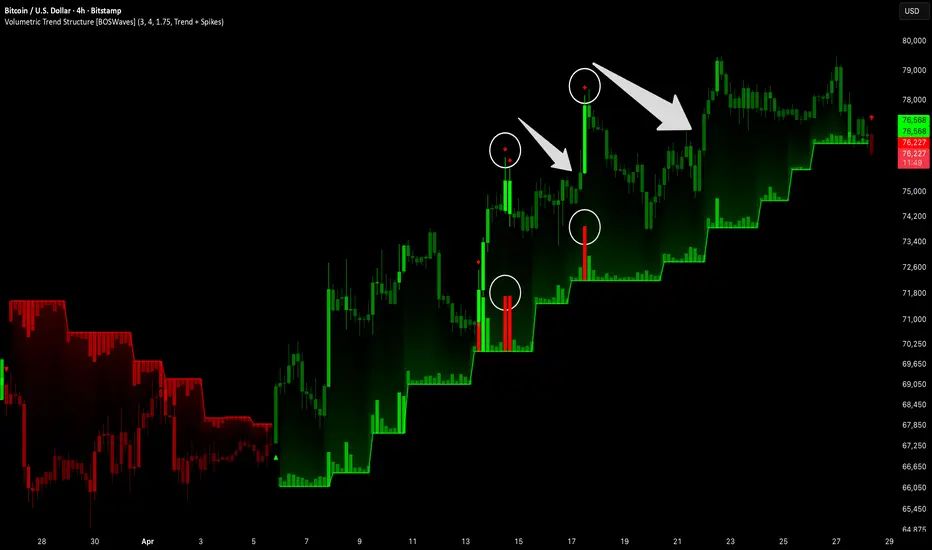
Volumetric Trend Structure [BOSWaves] - Pivot-Averaged Drift Detection with Volume-Normalized Band Visualization
Overview
Volumetric Trend Structure [BOSWaves] is a pivot-anchored trend identification system that constructs dynamic drift lines from the rolling average of confirmed swing highs and lows, where trend direction, band positioning, and volume histogram behavior are driven by structural pivot accumulation and statistically normalized volume measurement rather than fixed moving average thresholds or arbitrary volatility multiples.

Instead of relying on lagged moving average crossovers or static band calculations, trend state and directional reference levels are determined through confirmed pivot detection, multi-pivot averaging for drift line construction, and standard deviation-normalized volume scoring that adapts bar-by-bar to reflect genuine volume significance relative to recent history.
This creates a trend framework grounded in actual price structure rather than smoothed price derivatives. Drift lines move only when new confirmed pivots shift the structural average, trend state responds to price crossing structurally-derived boundaries, and the volume histogram mounted directly on the active band provides a continuously updating picture of volume participation intensity and directional character at the exact level that defines the current trend.
Price is therefore evaluated against drift boundaries that represent real swing structure rather than indicator-generated levels disconnected from market geometry.
Conceptual Framework
Volumetric Trend Structure is founded on the principle that robust trend boundaries should be derived from confirmed price structure pivots and their rolling averages, not from smoothed price series that shift continuously regardless of whether meaningful structural events have occurred.
Traditional trend-following methods anchor bands and trend references to exponential or simple moving averages that update on every bar and carry no structural significance in isolation. This framework replaces continuous-update logic with pivot-event-driven drift construction, where the upper and lower drift lines only shift when a new confirmed swing high or low is recorded, ensuring the boundaries reflect actual market structure rather than arithmetic price smoothing.
Three core principles guide the design:
This shifts trend analysis from continuous moving average mechanics into event-driven structural drift tracking with volume participation mapped directly onto the defining boundary.
Theoretical Foundation
The indicator combines confirmed pivot high and low detection, rolling pivot array averaging for drift line construction, standard deviation-normalized volume measurement, and directional volume gradient coloring across three configurable display modes.
Pivot highs and lows are confirmed using a configurable left-right bar requirement, ensuring only structurally validated swing points contribute to drift calculation. A rolling array of recent pivots feeds the upper and lower drift lines, with the average shifting only as new pivots register. Volume normalization divides raw volume by its rolling standard deviation, producing a dimensionless score that objectively ranks each bar's participation relative to recent history. Volume histogram bars are then plotted directly on the active drift band, scaled by the normalized score and oriented in the trend direction.
Four internal systems operate in tandem:
This design allows trend structure to reflect genuine pivot-based market geometry while volume participation is measured and visualized with statistical objectivity.
How It Works
Volumetric Trend Structure evaluates price through a sequence of structure-aware processes:
Together, these elements form a continuously updating structural trend map where pivot geometry defines the boundaries and volume participation is measured and displayed with statistical precision directly on those boundaries.
Interpretation
Volumetric Trend Structure should be interpreted as a pivot-derived structural trend system with volume participation mapped onto the active directional boundary:
Drift line positioning, active band proximity, and volume histogram behavior at the structural boundary collectively provide more information than any element in isolation.
Signal Logic & Visual Cues
Volumetric Trend Structure presents two primary structural interaction signals alongside continuous volume participation monitoring:
Volume spike detection provides continuous secondary context, with statistical outlier bars marked regardless of trend state to identify exceptional participation events that may precede structural developments.
Alert generation covers bullish and bearish trend state transitions for systematic structural monitoring workflows.
Strategy Integration
Volumetric Trend Structure fits within structural trend-following and volume-informed directional approaches:
Technical Implementation Details
Optimal Application Parameters
Timeframe Guidance:
Suggested Baseline Configuration:
These suggested parameters should be used as a baseline; their effectiveness depends on the instrument's structural characteristics, pivot frequency, and preferred trend sensitivity, so fine-tuning is expected for optimal performance.
Parameter Calibration Notes
Use the following adjustments to refine behavior without altering the core logic:
Adjustments should be incremental and evaluated across multiple session types rather than isolated market conditions.
Performance Characteristics
High Effectiveness:
Reduced Effectiveness:
Integration Guidelines
Disclaimer
Volumetric Trend Structure [BOSWaves] is a professional-grade pivot-derived trend and volume participation analysis tool. It uses confirmed swing pivot averaging with statistically normalized volume measurement but does not predict future price movements. Results depend on market conditions, instrument structural characteristics, parameter selection, and disciplined execution. BOSWaves recommends deploying this indicator within a broader analytical framework that incorporates momentum context, order flow analysis, and comprehensive risk management.
Overview
Volumetric Trend Structure [BOSWaves] is a pivot-anchored trend identification system that constructs dynamic drift lines from the rolling average of confirmed swing highs and lows, where trend direction, band positioning, and volume histogram behavior are driven by structural pivot accumulation and statistically normalized volume measurement rather than fixed moving average thresholds or arbitrary volatility multiples.
Instead of relying on lagged moving average crossovers or static band calculations, trend state and directional reference levels are determined through confirmed pivot detection, multi-pivot averaging for drift line construction, and standard deviation-normalized volume scoring that adapts bar-by-bar to reflect genuine volume significance relative to recent history.
This creates a trend framework grounded in actual price structure rather than smoothed price derivatives. Drift lines move only when new confirmed pivots shift the structural average, trend state responds to price crossing structurally-derived boundaries, and the volume histogram mounted directly on the active band provides a continuously updating picture of volume participation intensity and directional character at the exact level that defines the current trend.
Price is therefore evaluated against drift boundaries that represent real swing structure rather than indicator-generated levels disconnected from market geometry.
Conceptual Framework
Volumetric Trend Structure is founded on the principle that robust trend boundaries should be derived from confirmed price structure pivots and their rolling averages, not from smoothed price series that shift continuously regardless of whether meaningful structural events have occurred.
Traditional trend-following methods anchor bands and trend references to exponential or simple moving averages that update on every bar and carry no structural significance in isolation. This framework replaces continuous-update logic with pivot-event-driven drift construction, where the upper and lower drift lines only shift when a new confirmed swing high or low is recorded, ensuring the boundaries reflect actual market structure rather than arithmetic price smoothing.
Three core principles guide the design:
- Trend boundaries should emerge from confirmed pivot structure and their averages, providing structurally meaningful levels rather than arbitrary smoothed references.
- Volume should be measured relative to its own statistical distribution, normalizing significance across instruments and timeframes rather than using raw absolute values.
- Volume visualization should be anchored to the active structural boundary, directly connecting participation data to the trend level that defines current directional state.
This shifts trend analysis from continuous moving average mechanics into event-driven structural drift tracking with volume participation mapped directly onto the defining boundary.
Theoretical Foundation
The indicator combines confirmed pivot high and low detection, rolling pivot array averaging for drift line construction, standard deviation-normalized volume measurement, and directional volume gradient coloring across three configurable display modes.
Pivot highs and lows are confirmed using a configurable left-right bar requirement, ensuring only structurally validated swing points contribute to drift calculation. A rolling array of recent pivots feeds the upper and lower drift lines, with the average shifting only as new pivots register. Volume normalization divides raw volume by its rolling standard deviation, producing a dimensionless score that objectively ranks each bar's participation relative to recent history. Volume histogram bars are then plotted directly on the active drift band, scaled by the normalized score and oriented in the trend direction.
Four internal systems operate in tandem:
- Pivot Detection and Array Management: Identifies confirmed swing highs and lows through the configurable pivot length parameter, maintaining rolling arrays of the most recent qualifying pivots for both upper and lower drift calculations.
- Drift Line Construction: Averages the contents of each rolling pivot array to produce upper and lower drift lines that update only when new confirmed pivots register, anchoring the trend framework to real structural events.
- Trend State Logic: Monitors price crossovers and crossunders of the upper and lower drift lines respectively, flipping trend state and reassigning the active band between the upper and lower drift lines based on current direction.
- Volume Normalization and Histogram Engine: Calculates a standard deviation-based volume score, scales it to the chart's price range, and plots histogram bars on the active drift band with configurable directional coloring and spike detection.
This design allows trend structure to reflect genuine pivot-based market geometry while volume participation is measured and visualized with statistical objectivity.
How It Works
Volumetric Trend Structure evaluates price through a sequence of structure-aware processes:
- Pivot Confirmation: Swing highs and lows are confirmed when the specified number of bars to the left and right all print lower highs or higher lows respectively, validating structural significance before the pivot is registered.
- Array Update and Drift Recalculation: Each newly confirmed pivot is appended to its respective rolling array and the oldest entry removed if the array exceeds the configured pivot count, triggering immediate recalculation of the corresponding drift line average.
- Trend Crossover Evaluation: On each bar, price is tested against both drift lines. A crossover above the upper drift establishes bullish state, and a crossunder below the lower drift establishes bearish state, with the previously opposing drift line becoming the new active band.
- Active Band Assignment: In a bullish trend, the lower drift line serves as the active structural band providing support reference. In a bearish trend, the upper drift line serves as the active structural band providing resistance reference.
- Volume Normalization: Each bar's raw volume is divided by its 200-bar rolling standard deviation, producing a normalized score capped at four standard deviations that objectively quantifies participation intensity.
- Histogram Scaling: The normalized volume score is multiplied by a range-derived step size based on the 200-bar average bar range, producing price-unit histogram heights that scale appropriately to the chart without manual adjustment.
- Volume Color Assignment: Depending on the selected color mode, histogram bars are colored by buy/sell pressure gradient derived from close position within the bar range (Delta), uniform trend direction (Trend), or trend direction with statistical spike highlighting (Trend + Spikes).
- Spike Detection: Bars reaching four standard deviations of volume receive spike classification, triggering directional spike markers and overriding base color in applicable color modes.
- Signal and Visual Output: Trend state transitions generate buy and sell triangle labels. Candles are colored with a volume-intensity gradient that brightens with participation strength. A trend fill extends between the active band and price for directional context.
Together, these elements form a continuously updating structural trend map where pivot geometry defines the boundaries and volume participation is measured and displayed with statistical precision directly on those boundaries.
Interpretation
Volumetric Trend Structure should be interpreted as a pivot-derived structural trend system with volume participation mapped onto the active directional boundary:
- Bullish Trend State (Green): Established when price closes above the upper drift line, with the lower drift line becoming the active support band and volume histogram projecting upward from it.
- Bearish Trend State (Magenta): Established when price closes below the lower drift line, with the upper drift line becoming the active resistance band and volume histogram projecting downward from it.
- Drift Lines: Upper and lower structural boundaries derived from rolling averages of recent confirmed pivot highs and lows. These lines only shift when new confirmed pivots register, ensuring structural relevance.
- Active Band: The drift line currently serving as the primary structural reference. The lower drift in a bullish trend and the upper drift in a bearish trend are displayed with a solid colored line and serve as the histogram anchor.
- Trend Fill: Gradient fill between the active band and price provides a continuous visual representation of the distance and directional relationship between current price and the structural boundary.
- Volume Histogram: Normalized volume bars extending from the active drift band reflect statistically scaled participation intensity on each bar, oriented upward in a bull trend and downward in a bear trend.
- Delta Color Mode: Histogram bars colored by close-position gradient within the bar range, revealing whether volume on each bar was associated with buying or selling pressure regardless of trend direction.
- Trend Color Mode: Uniform histogram coloring by current trend direction, providing a clean structural participation view without directional bar-level interpretation.
- Trend + Spikes Mode: Trend-colored histogram with statistical spike bars highlighted in a distinct color, identifying exceptional participation events against the structural background.
- ◆ Spike Markers: Diamond labels plotted at bar highs in a bull trend and lows in a bear trend on statistically exceptional volume bars, marking participation outliers for immediate identification.
- ▲ / ▼ Trend Signals: Triangle labels at trend state transitions mark the crossover bar where the structural drift boundary was breached, providing clear visual anchoring of each directional change.
- Colored Candles: Optional bar coloring reflects trend direction with intensity graduating from muted at low volume to fully saturated at peak participation, providing an immediate conviction reading. Note: The original chart candles must be disabled in chart settings for the trend-colored candles to display properly.
Drift line positioning, active band proximity, and volume histogram behavior at the structural boundary collectively provide more information than any element in isolation.
Signal Logic & Visual Cues
Volumetric Trend Structure presents two primary structural interaction signals alongside continuous volume participation monitoring:
- Buy Signal (▲): Green triangle appears when price closes above the upper drift line, marking the structural crossover that establishes bullish trend state and reassigns the lower drift as the active support band.
- Sell Signal (▼): Red triangle appears when price closes below the lower drift line, marking the structural crossunder that establishes bearish trend state and reassigns the upper drift as the active resistance band.
Volume spike detection provides continuous secondary context, with statistical outlier bars marked regardless of trend state to identify exceptional participation events that may precede structural developments.
Alert generation covers bullish and bearish trend state transitions for systematic structural monitoring workflows.
Strategy Integration
Volumetric Trend Structure fits within structural trend-following and volume-informed directional approaches:
- Structure-Confirmed Entries: Use drift line crossovers as trend initiation points where price has demonstrated sufficient strength to breach a structurally-derived boundary, rather than reacting to moving average crossovers with no pivot significance.
- Active Band Pullback Framework: Use the active drift band as a pullback reference within established trends, monitoring volume histogram behavior at the band for participation evidence supporting continuation.
- Volume Spike Context: Treat spike events occurring near the active drift band as elevated-significance participation readings. Spikes confirming the trend direction at the band suggest strong structural support or resistance.
- Delta Mode Flow Analysis: In Delta color mode, monitor the directional gradient of histogram bars at the active band to assess whether volume at the structural boundary is predominantly buying or selling pressure.
- Pivot Count Sensitivity Adjustment: Reduce the Pivots to Average count for instruments requiring faster structural adaptation. Increase for markets where drift stability across more pivots better reflects the dominant trend.
- Multi-Timeframe Structural Alignment: Apply higher-timeframe drift line positions as directional context, confirming that lower-timeframe entries align with the broader structural trend defined by multi-pivot averaging.
Technical Implementation Details
- Core Engine: Confirmed pivot high and low detection with configurable left-right bar requirement
- Drift Construction: Rolling array averaging of recent confirmed pivots with configurable array depth
- Trend Logic: Drift line crossover and crossunder state switching with active band reassignment
- Volume Normalization: Standard deviation-based scoring over 200-bar rolling window with four standard deviation cap
- Histogram Scaling: Range-derived step sizing using 200-bar average bar range for chart-adaptive bar heights
- Color Engine: Three-mode volume coloring with gradient delta, uniform trend, and trend with spike override
- Visualization: Band-anchored volume histogram, trend fill gradient, volume-intensity candle coloring, and signal labels
- Performance Profile: Optimized for real-time execution with max_bars_back configuration supporting deep historical pivot detection
Optimal Application Parameters
Timeframe Guidance:
- 1 - 5 min: Intraday structural drift tracking with tighter pivot lengths for faster structural response
- 15 - 60 min: Session-level trend structure identification with balanced pivot and averaging settings
- 4H - Daily: Swing-level structural trend mapping with higher pivot counts for stable, well-defined drift lines
Suggested Baseline Configuration:
- Pivot Length: 3
- Pivots to Average: 4
- Volume Size: 1.0
- Volume Histogram: Enabled
- Volume Color Mode: Trend + Spikes
- Color Candles: Enabled (requires disabling original chart candles in chart settings)
- Trend Fill: Enabled
These suggested parameters should be used as a baseline; their effectiveness depends on the instrument's structural characteristics, pivot frequency, and preferred trend sensitivity, so fine-tuning is expected for optimal performance.
Parameter Calibration Notes
Use the following adjustments to refine behavior without altering the core logic:
- Too many trend flips: Increase Pivot Length to demand more structurally significant swing confirmations, reducing sensitivity to minor price swings that generate short-lived drift line crossovers.
- Trend too slow to respond: Decrease Pivot Length toward 1 for faster pivot confirmation, or reduce Pivots to Average so fewer historical pivots influence the drift line position.
- Drift lines too reactive: Increase Pivots to Average to smooth the drift calculation across more structural events, producing more stable trend boundaries that require more significant pivot shifts to move.
- Drift lines too stable: Decrease Pivots to Average toward 2 for a more responsive drift that closely tracks the most recent structural swings rather than the broader pivot average.
- Volume bars too large or too small: Adjust Volume Size to scale histogram height relative to the default range-derived step, adapting visibility to the instrument's typical price range and volatility.
- Spike highlights too frequent: The spike threshold is fixed at four standard deviations and is not user-configurable. Select Trend color mode if spike highlighting creates excessive visual noise on a particular instrument.
- Delta coloring unclear: Review whether close positioning within the bar range reliably reflects directional pressure on the target instrument before relying on Delta mode for flow analysis.
Adjustments should be incremental and evaluated across multiple session types rather than isolated market conditions.
Performance Characteristics
High Effectiveness:
- Trending markets with clear swing structure where pivot highs and lows produce well-separated drift lines that provide unambiguous structural boundaries
- Instruments with consistent volume patterns where standard deviation normalization accurately identifies statistically significant participation events
- Structural pullback strategies monitoring price returns to the active drift band with volume confirmation
- Markets where volume participation at swing pivots reliably reflects institutional activity and structural conviction
Reduced Effectiveness:
- Choppy, trendless markets where frequent pivot formation causes rapid drift line convergence and repeated trend state flips without directional follow-through
- Low-liquidity instruments where volume distribution is erratic and standard deviation normalization produces unreliable spike classifications
- Markets with irregular pivot structure where swing confirmation requirements cause significant lag in structural boundary updates during fast-moving directional moves
- Extremely compressed consolidation environments where upper and lower drift lines converge closely, reducing the structural differentiation required for reliable trend state assignment
- News-driven or gap-heavy instruments where pivot confirmation mechanics miss the structural significance of impulsive moves that do not form clean swing geometry
Integration Guidelines
- Confluence: Combine with BOSWaves momentum tools, order flow analysis, or exhaustion level mapping for structural and conviction-layer confluence
- Active Band Respect: Monitor volume histogram behavior at the active drift band on each approach. Sustained low-volume retests suggest structural support, while high-volume penetration attempts warrant caution.
- Pivot Count Awareness: Recognize that drift lines reflect the average of recent pivots rather than just the latest swing. Sharp structural moves may shift the drift line gradually as older pivots roll out of the averaging window.
- Spike Utilization: Treat spike events as participation outliers deserving contextual analysis rather than automatic signals. Their directional significance depends on location relative to the active band and current trend state.
- State Discipline: Maintain directional bias aligned with current trend state until the opposing drift line is breached. Short-term price excursions toward the inactive drift line within an established trend do not constitute state changes.
Disclaimer
Volumetric Trend Structure [BOSWaves] is a professional-grade pivot-derived trend and volume participation analysis tool. It uses confirmed swing pivot averaging with statistically normalized volume measurement but does not predict future price movements. Results depend on market conditions, instrument structural characteristics, parameter selection, and disciplined execution. BOSWaves recommends deploying this indicator within a broader analytical framework that incorporates momentum context, order flow analysis, and comprehensive risk management.
Skrypt open-source
W zgodzie z duchem TradingView twórca tego skryptu udostępnił go jako open-source, aby użytkownicy mogli przejrzeć i zweryfikować jego działanie. Ukłony dla autora. Korzystanie jest bezpłatne, jednak ponowna publikacja kodu podlega naszym Zasadom serwisu.

Wyłączenie odpowiedzialności
Informacje i publikacje nie stanowią i nie powinny być traktowane jako porady finansowe, inwestycyjne, tradingowe ani jakiekolwiek inne rekomendacje dostarczane lub zatwierdzone przez TradingView. Więcej informacji znajduje się w Warunkach użytkowania.
Skrypt open-source
W zgodzie z duchem TradingView twórca tego skryptu udostępnił go jako open-source, aby użytkownicy mogli przejrzeć i zweryfikować jego działanie. Ukłony dla autora. Korzystanie jest bezpłatne, jednak ponowna publikacja kodu podlega naszym Zasadom serwisu.
Wyłączenie odpowiedzialności
Informacje i publikacje nie stanowią i nie powinny być traktowane jako porady finansowe, inwestycyjne, tradingowe ani jakiekolwiek inne rekomendacje dostarczane lub zatwierdzone przez TradingView. Więcej informacji znajduje się w Warunkach użytkowania.