OPEN-SOURCE SCRIPT
Zaktualizowano Liquidity Void Navigator [AGPro Series]
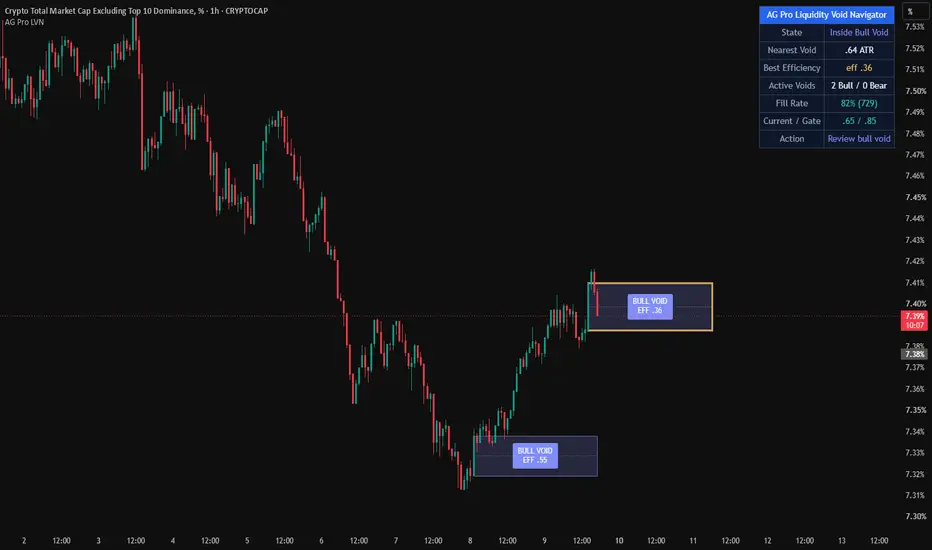
Liquidity Void Navigator [AGPro Series]
🔹 OVERVIEW
Liquidity Void Navigator identifies impulsive price displacements that were produced with disproportionately low volume participation — the institutional footprint of a true liquidity void. Unlike geometric gap concepts that rely purely on wick-to-wick imbalance, this engine measures the efficiency of each impulsive bar: how much price moved relative to how much volume was transacted. When price travels faster than the order book justifies, a magnet zone is born. These zones frequently act as high-probability retest and mean-reversion targets for SMC and ICT traders.
🔹 UNIQUE EDGE
Most gap-based tools on TradingView detect Fair Value Gaps using a 3-bar geometric pattern. This indicator uses a fundamentally different signature:
- Volume Efficiency Ratio (core innovation): efficiency = (volume / avgVol) / (range / ATR). Values below the threshold reveal bars where price displacement outpaced volume effort — the statistical definition of a liquidity void.
- Body-based zones, not wick-to-wick: the void box spans the impulsive candle body, excluding wicks that represent liquidity sweeps.
- Dynamic lifecycle management: zones are tracked from birth through mid-line mitigation, with configurable trigger modes (close cross, wick touch, or full fill).
- Strongest-void emphasis: the lowest-efficiency active void automatically receives a bold neutral-colored border, giving traders an at-a-glance view of the most reliable magnet on the chart.
🔹 METHODOLOGY
Each completed bar is evaluated against four quality filters:
1. Range Expansion — bar range must exceed ATR × configurable multiplier (default 1.3).
2. Volume Efficiency — the efficiency ratio must fall below the configurable cap (default 0.85).
3. Minimum Height — void must be at least a fraction of ATR to filter micro-noise (default 0.5×).
4. Body Dominance — the candle body must represent at least 50% of the total range, confirming directional conviction rather than indecision.
Qualifying bars create a directional void zone spanning the body. An optional next-bar gap confirmation adds stricter FVG-style filtering. Active zones are continuously evaluated against the selected mitigation mode and updated in real time. Oldest active voids are pruned when the per-side cap is exceeded, keeping the chart focused on recent, actionable structure.
🔹 SIGNALS & ALERTS
Four alert conditions are available:
- New Bullish Liquidity Void — an upward impulsive void is detected.
- New Bearish Liquidity Void — a downward impulsive void is detected.
- Bull Void Mitigated — closing price crosses the mid-line of an active bullish void from above.
- Bear Void Mitigated — closing price crosses the mid-line of an active bearish void from below.
Each alert fires only on bar close to eliminate repainting concerns. Alert messages include the ticker and timeframe for multi-chart workflows.
🔹 KEY INPUTS
Void Detection
- Volume Baseline Lookback — window for average volume and range calculations.
- Min Range Expansion (×ATR) — minimum impulsive bar size.
- Max Volume Efficiency Ratio — core void qualification threshold.
- Min Void Height (×ATR) — filters micro-voids.
- Require Gap with Next Bar — optional strict confirmation.
- Mitigation Trigger — choose between Close Cross (institutional default), Wick Touch (strict), or Full Fill (swing).
Lifecycle
- Max Active Voids per Side — visual cap to prevent chart clutter.
- Zone Right Extension — how far zones project to the right.
- Show Mitigated Voids — optionally display filled zones in gray.
Visuals
- Bullish / Bearish / Mitigated colors, mid-line toggle, projection arrow toggle, label size.
Panel
- Show / position / font size.
🔹 HOW TO USE
Trend-aligned reversion entries: When price returns to an unmitigated void in the direction of the higher-timeframe trend, watch for rejection at the mid-line or far edge as a potential long (bull void) or short (bear void) trigger.
Breakout continuation context: Newly formed voids in the direction of a breakout often indicate institutional participation. Waiting for a retest of the void zone can provide improved risk-to-reward compared to chasing the breakout bar.
Strongest-void bias: The yellow-bordered void on the chart represents the lowest-efficiency (statistically strongest) active zone. Traders can treat it as the highest-probability magnet for price revisits.
Fill Rate context: A persistently high fill rate on a given symbol or timeframe indicates that voids fill rapidly — more suitable for scalping. A lower fill rate suggests that unfilled voids accumulate meaningfully, offering swing-style opportunities.
Multi-timeframe workflow: Identify voids on a higher timeframe (4H or 1D) as strategic bias zones, then use a lower timeframe (15m or 1H) for tactical execution when price approaches those higher-timeframe voids.
🔹 LIMITATIONS & TRANSPARENCY
- This indicator is built for liquid markets with reliable volume data. Thinly traded symbols or instruments without accurate volume feeds (some spot FX, certain indices) will produce unreliable results.
- Not every detected void will be retested or filled. Voids are statistical zones of interest, not guarantees.
- The indicator is a visualization and analytical tool, not a trading strategy. It does not generate buy or sell recommendations.
- Fill rate statistics are computed over the visible history of active and mitigated voids and are approximate; they are intended as a relative gauge of symbol behavior, not as a backtested performance metric.
- Mitigation triggers are bar-close based to avoid repainting. Intrabar signals may appear and disappear until the bar confirms.
- Zones have a fixed right extension from their birth bar; the indicator does not extend zones infinitely.
🔹 RISK DISCLOSURE
Trading financial markets involves substantial risk of loss and is not suitable for all investors. Past performance of any technical indicator, including this one, is not indicative of future results. This tool is provided for educational and analytical purposes only and does not constitute financial advice, investment recommendations, or solicitation to trade. Users are solely responsible for their own trading decisions, risk management, and outcomes. Always conduct independent analysis and consult with a qualified financial advisor before making investment decisions.
🔹 OVERVIEW
Liquidity Void Navigator identifies impulsive price displacements that were produced with disproportionately low volume participation — the institutional footprint of a true liquidity void. Unlike geometric gap concepts that rely purely on wick-to-wick imbalance, this engine measures the efficiency of each impulsive bar: how much price moved relative to how much volume was transacted. When price travels faster than the order book justifies, a magnet zone is born. These zones frequently act as high-probability retest and mean-reversion targets for SMC and ICT traders.
🔹 UNIQUE EDGE
Most gap-based tools on TradingView detect Fair Value Gaps using a 3-bar geometric pattern. This indicator uses a fundamentally different signature:
- Volume Efficiency Ratio (core innovation): efficiency = (volume / avgVol) / (range / ATR). Values below the threshold reveal bars where price displacement outpaced volume effort — the statistical definition of a liquidity void.
- Body-based zones, not wick-to-wick: the void box spans the impulsive candle body, excluding wicks that represent liquidity sweeps.
- Dynamic lifecycle management: zones are tracked from birth through mid-line mitigation, with configurable trigger modes (close cross, wick touch, or full fill).
- Strongest-void emphasis: the lowest-efficiency active void automatically receives a bold neutral-colored border, giving traders an at-a-glance view of the most reliable magnet on the chart.
🔹 METHODOLOGY
Each completed bar is evaluated against four quality filters:
1. Range Expansion — bar range must exceed ATR × configurable multiplier (default 1.3).
2. Volume Efficiency — the efficiency ratio must fall below the configurable cap (default 0.85).
3. Minimum Height — void must be at least a fraction of ATR to filter micro-noise (default 0.5×).
4. Body Dominance — the candle body must represent at least 50% of the total range, confirming directional conviction rather than indecision.
Qualifying bars create a directional void zone spanning the body. An optional next-bar gap confirmation adds stricter FVG-style filtering. Active zones are continuously evaluated against the selected mitigation mode and updated in real time. Oldest active voids are pruned when the per-side cap is exceeded, keeping the chart focused on recent, actionable structure.
🔹 SIGNALS & ALERTS
Four alert conditions are available:
- New Bullish Liquidity Void — an upward impulsive void is detected.
- New Bearish Liquidity Void — a downward impulsive void is detected.
- Bull Void Mitigated — closing price crosses the mid-line of an active bullish void from above.
- Bear Void Mitigated — closing price crosses the mid-line of an active bearish void from below.
Each alert fires only on bar close to eliminate repainting concerns. Alert messages include the ticker and timeframe for multi-chart workflows.
🔹 KEY INPUTS
Void Detection
- Volume Baseline Lookback — window for average volume and range calculations.
- Min Range Expansion (×ATR) — minimum impulsive bar size.
- Max Volume Efficiency Ratio — core void qualification threshold.
- Min Void Height (×ATR) — filters micro-voids.
- Require Gap with Next Bar — optional strict confirmation.
- Mitigation Trigger — choose between Close Cross (institutional default), Wick Touch (strict), or Full Fill (swing).
Lifecycle
- Max Active Voids per Side — visual cap to prevent chart clutter.
- Zone Right Extension — how far zones project to the right.
- Show Mitigated Voids — optionally display filled zones in gray.
Visuals
- Bullish / Bearish / Mitigated colors, mid-line toggle, projection arrow toggle, label size.
Panel
- Show / position / font size.
🔹 HOW TO USE
Trend-aligned reversion entries: When price returns to an unmitigated void in the direction of the higher-timeframe trend, watch for rejection at the mid-line or far edge as a potential long (bull void) or short (bear void) trigger.
Breakout continuation context: Newly formed voids in the direction of a breakout often indicate institutional participation. Waiting for a retest of the void zone can provide improved risk-to-reward compared to chasing the breakout bar.
Strongest-void bias: The yellow-bordered void on the chart represents the lowest-efficiency (statistically strongest) active zone. Traders can treat it as the highest-probability magnet for price revisits.
Fill Rate context: A persistently high fill rate on a given symbol or timeframe indicates that voids fill rapidly — more suitable for scalping. A lower fill rate suggests that unfilled voids accumulate meaningfully, offering swing-style opportunities.
Multi-timeframe workflow: Identify voids on a higher timeframe (4H or 1D) as strategic bias zones, then use a lower timeframe (15m or 1H) for tactical execution when price approaches those higher-timeframe voids.
🔹 LIMITATIONS & TRANSPARENCY
- This indicator is built for liquid markets with reliable volume data. Thinly traded symbols or instruments without accurate volume feeds (some spot FX, certain indices) will produce unreliable results.
- Not every detected void will be retested or filled. Voids are statistical zones of interest, not guarantees.
- The indicator is a visualization and analytical tool, not a trading strategy. It does not generate buy or sell recommendations.
- Fill rate statistics are computed over the visible history of active and mitigated voids and are approximate; they are intended as a relative gauge of symbol behavior, not as a backtested performance metric.
- Mitigation triggers are bar-close based to avoid repainting. Intrabar signals may appear and disappear until the bar confirms.
- Zones have a fixed right extension from their birth bar; the indicator does not extend zones infinitely.
🔹 RISK DISCLOSURE
Trading financial markets involves substantial risk of loss and is not suitable for all investors. Past performance of any technical indicator, including this one, is not indicative of future results. This tool is provided for educational and analytical purposes only and does not constitute financial advice, investment recommendations, or solicitation to trade. Users are solely responsible for their own trading decisions, risk management, and outcomes. Always conduct independent analysis and consult with a qualified financial advisor before making investment decisions.
Informacje o Wersji
UPDATE NOTES - V1.2This update focuses on publication readability, visual hierarchy, and reduced label duplication.
The core purpose of the script remains unchanged.
This release improves how the existing Liquidity Void zones are presented on dense intraday charts.
This script continues to function as an analytical and visualization tool.
It does not attempt to predict price direction or provide guaranteed outcomes.
------------------------
What Changed
------------------------
* Changed Show Outside Labels default to Off.
Centered zone badges now act as the primary void ownership label by default.
* Changed Show Fill Projection Arrow default to Off.
Projection arrows remain available, but the default screenshot view is calmer and more premium.
* Preserved centered void badges.
BULL VOID / EFF xx and BEAR VOID / EFF xx badges remain enabled by default inside the zone itself.
* Preserved the original Liquidity Void engine.
Volume baseline, range expansion, efficiency ratio, body displacement, mitigation modes, strongest-void highlighting, panel metrics, and alerts remain unchanged.
------------------------
Visual Improvements
------------------------
* Reduced duplicate information by avoiding outside labels and centered badges at the same time.
* Improved chart readability on 1H and 4H views where multiple voids can cluster.
* Reduced the chance of labels being clipped near the left edge of the visible chart.
* Kept the active zones visually populated through centered badges, so the chart does not look empty.
------------------------
Interface & Usability
------------------------
* Users can still re-enable outside labels from settings when reviewing historical signals.
* Users can still re-enable projection arrows from settings when they want directional fill guides.
* Default settings now prioritize publication screenshots and first-glance clarity.
------------------------
Behavior Notes
------------------------
This update does not change the core analytical logic of the script.
Void detection, efficiency scoring, mitigation logic, strongest-void highlight, fill-rate calculation, and alerts should be interpreted the same way as before.
The goal is to improve clarity and usability, not to introduce new predictive behavior.
------------------------
Limitations Reminder
------------------------
The script remains a rule-based analytical tool.
Market conditions such as volatility, volume quality, liquidity, timeframe differences, and symbol-specific volume behavior may affect void detection and mitigation.
Outputs should always be interpreted within broader market context.
------------------------
Risk Reminder
------------------------
This script is for educational and analytical purposes only.
It does not provide financial advice or guaranteed trading outcomes.
Users remain responsible for their own decisions.
Informacje o Wersji
🔧 UPDATE NOTES - v1.3This update focuses on readability, an honest fill-rate proof, and clearer action context.
The core purpose of the script remains unchanged.
It continues to detect volume-based liquidity voids and map their mitigation behavior.
This script continues to function as an analytical and visualization tool.
It does not attempt to predict price direction or provide guaranteed outcomes.
------------------------
What Changed
------------------------
- Windowed Fill Rate proof
The Fill Rate now measures how often a void mitigates within a defined review window instead of
counting every void that eventually fills, with the sample count shown. This keeps the number
realistic rather than drifting toward 100% over long histories.
- New Fill Review Window setting
A dedicated window controls how long fill behavior is measured for each void.
- Action row
The panel now translates the current void context into a single clear next-action line.
- Contrast-safe void badges
Centered void badges now pick readable dark or light text automatically based on the badge color,
so bearish void badges are no longer hard to read.
------------------------
Visual Improvements
------------------------
- Improved badge readability with automatic text contrast
- Kept the existing void zones, mid-lines, strongest-void highlight and right extension unchanged
- Reduced first-glance ambiguity on bearish void badges
- Preserved the clean, capped active-void layout
------------------------
Interface & Usability
------------------------
- Added an at-a-glance Action row for clearer decision context
- Replaced the lifetime fill rate with a windowed, sample-counted fill rate
- Kept the state, nearest, strongest, active-count and efficiency rows familiar
- Enhanced overall user experience without changing core detection logic
------------------------
Behavior Notes
------------------------
This update does not change the core void detection logic of the script.
Range expansion, volume efficiency, void height, mitigation triggers and the strongest-void
highlight all behave as before. The windowed Fill Rate is a separate historical track-record layer.
------------------------
Limitations Reminder
------------------------
The script remains a rule-based analytical tool.
Market conditions such as volatility, liquidity and timeframe differences may affect how voids and
the fill rate appear.
Outputs should always be interpreted within broader market context.
------------------------
Risk Reminder
------------------------
This script is for educational and analytical purposes only.
It does not provide financial advice or guaranteed trading outcomes.
Users remain responsible for their own decisions.
Informacje o Wersji
Version 1.5 – Panel Meaning ClarityThis update removes ambiguity from the panel language while preserving void detection, lifecycle management, mitigation logic, alerts, and Fill Rate proof.
• Renamed the Efficiency row to Current / Gate so the live candle-efficiency reading is clearly distinguished from Best Efficiency among active voids.
• Replaced React to bull fill and React to bear fill with neutral Review bull void and Review bear void workflow language.
• Preserved the cleaner four-void-per-side lifecycle and confirmed-bar alert behavior introduced in Version 1.4.
Skrypt open-source
W zgodzie z duchem TradingView twórca tego skryptu udostępnił go jako open-source, aby użytkownicy mogli przejrzeć i zweryfikować jego działanie. Ukłony dla autora. Korzystanie jest bezpłatne, jednak ponowna publikacja kodu podlega naszym Zasadom serwisu.

Trading Suite | Flagship Workflow :
tradingview.com/script/XJmX3p98-Trading-Suite-AGPro-Series/
Crypto Setup Planner | Multi-Symbol Analysis :
tradingview.com/script/LgVRo7Ql-Crypto-Setup-Planner-AGPro-Series/
tradingview.com/script/XJmX3p98-Trading-Suite-AGPro-Series/
Crypto Setup Planner | Multi-Symbol Analysis :
tradingview.com/script/LgVRo7Ql-Crypto-Setup-Planner-AGPro-Series/
Wyłączenie odpowiedzialności
Informacje i publikacje nie stanowią i nie powinny być traktowane jako porady finansowe, inwestycyjne, tradingowe ani jakiekolwiek inne rekomendacje dostarczane lub zatwierdzone przez TradingView. Więcej informacji znajduje się w Warunkach użytkowania.
Skrypt open-source
W zgodzie z duchem TradingView twórca tego skryptu udostępnił go jako open-source, aby użytkownicy mogli przejrzeć i zweryfikować jego działanie. Ukłony dla autora. Korzystanie jest bezpłatne, jednak ponowna publikacja kodu podlega naszym Zasadom serwisu.
Trading Suite | Flagship Workflow :
tradingview.com/script/XJmX3p98-Trading-Suite-AGPro-Series/
Crypto Setup Planner | Multi-Symbol Analysis :
tradingview.com/script/LgVRo7Ql-Crypto-Setup-Planner-AGPro-Series/
tradingview.com/script/XJmX3p98-Trading-Suite-AGPro-Series/
Crypto Setup Planner | Multi-Symbol Analysis :
tradingview.com/script/LgVRo7Ql-Crypto-Setup-Planner-AGPro-Series/
Wyłączenie odpowiedzialności
Informacje i publikacje nie stanowią i nie powinny być traktowane jako porady finansowe, inwestycyjne, tradingowe ani jakiekolwiek inne rekomendacje dostarczane lub zatwierdzone przez TradingView. Więcej informacji znajduje się w Warunkach użytkowania.