OPEN-SOURCE SCRIPT
VolumeMA
VolumeMA
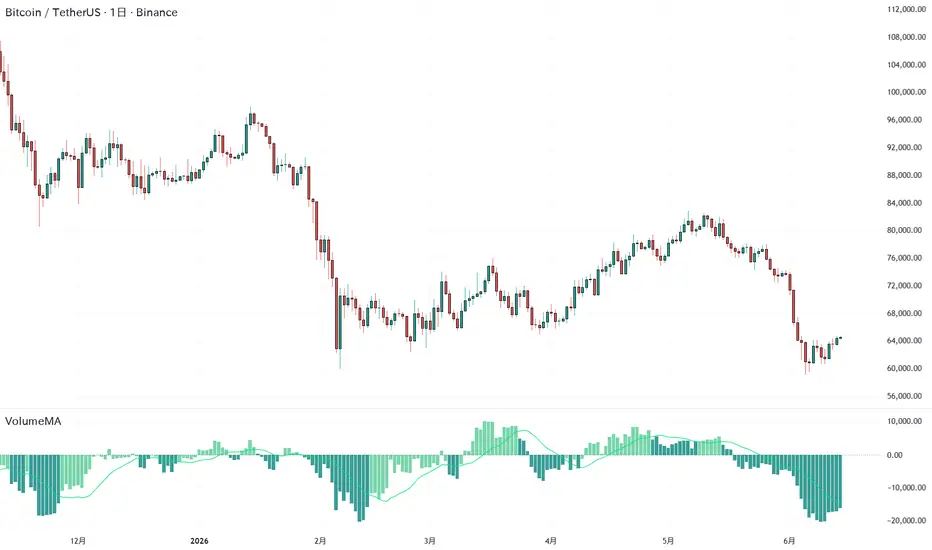
VolumeMA is a volume-based indicator designed to visualize market participation by combining trading volume with price direction.
Unlike traditional volume indicators that display only raw volume, VolumeMA assigns positive volume to rising price bars and negative volume to falling price bars. This helps traders identify whether buying or selling pressure is dominating the market.
The indicator smooths these values using a moving average, reducing short-term noise and making underlying market participation easier to observe.
Features
Directional Volume
Volume is assigned based on price movement:
* Rising price bar → Positive volume
* Falling price bar → Negative volume
This allows traders to quickly identify whether buyers or sellers are currently in control.
Volume Moving Average
The directional volume is smoothed using a Simple Moving Average (SMA), creating the Volume Moving Average histogram.
This helps highlight trends in market participation rather than focusing on individual volume spikes.
SMA Signal Line
An additional SMA is applied to the Volume Moving Average.
When the Volume Moving Average is above its SMA, market participation is considered relatively strong.
When it is below its SMA, market participation is considered relatively weak.
Zero Line
The zero line separates bullish and bearish volume pressure:
* Above zero → Buying pressure dominates
* Below zero → Selling pressure dominates
Color Visualization
Histogram colors automatically change depending on whether the Volume Moving Average is above or below its SMA, making shifts in momentum easier to identify.
Usage
VolumeMA is designed as a complementary tool for market analysis. It can be used alongside price action, trend analysis, and other indicators to better understand market participation and momentum.
As with any indicator, it should not be used in isolation and does not guarantee future performance.
VolumeMA is a volume-based indicator designed to visualize market participation by combining trading volume with price direction.
Unlike traditional volume indicators that display only raw volume, VolumeMA assigns positive volume to rising price bars and negative volume to falling price bars. This helps traders identify whether buying or selling pressure is dominating the market.
The indicator smooths these values using a moving average, reducing short-term noise and making underlying market participation easier to observe.
Features
Directional Volume
Volume is assigned based on price movement:
* Rising price bar → Positive volume
* Falling price bar → Negative volume
This allows traders to quickly identify whether buyers or sellers are currently in control.
Volume Moving Average
The directional volume is smoothed using a Simple Moving Average (SMA), creating the Volume Moving Average histogram.
This helps highlight trends in market participation rather than focusing on individual volume spikes.
SMA Signal Line
An additional SMA is applied to the Volume Moving Average.
When the Volume Moving Average is above its SMA, market participation is considered relatively strong.
When it is below its SMA, market participation is considered relatively weak.
Zero Line
The zero line separates bullish and bearish volume pressure:
* Above zero → Buying pressure dominates
* Below zero → Selling pressure dominates
Color Visualization
Histogram colors automatically change depending on whether the Volume Moving Average is above or below its SMA, making shifts in momentum easier to identify.
Usage
VolumeMA is designed as a complementary tool for market analysis. It can be used alongside price action, trend analysis, and other indicators to better understand market participation and momentum.
As with any indicator, it should not be used in isolation and does not guarantee future performance.
Skrypt open-source
W zgodzie z duchem TradingView twórca tego skryptu udostępnił go jako open-source, aby użytkownicy mogli przejrzeć i zweryfikować jego działanie. Ukłony dla autora. Korzystanie jest bezpłatne, jednak ponowna publikacja kodu podlega naszym Zasadom serwisu.

Wyłączenie odpowiedzialności
Informacje i publikacje nie stanowią i nie powinny być traktowane jako porady finansowe, inwestycyjne, tradingowe ani jakiekolwiek inne rekomendacje dostarczane lub zatwierdzone przez TradingView. Więcej informacji znajduje się w Warunkach użytkowania.
Skrypt open-source
W zgodzie z duchem TradingView twórca tego skryptu udostępnił go jako open-source, aby użytkownicy mogli przejrzeć i zweryfikować jego działanie. Ukłony dla autora. Korzystanie jest bezpłatne, jednak ponowna publikacja kodu podlega naszym Zasadom serwisu.
Wyłączenie odpowiedzialności
Informacje i publikacje nie stanowią i nie powinny być traktowane jako porady finansowe, inwestycyjne, tradingowe ani jakiekolwiek inne rekomendacje dostarczane lub zatwierdzone przez TradingView. Więcej informacji znajduje się w Warunkach użytkowania.