OPEN-SOURCE SCRIPT
Combined RSI + ADX/DI + Stochastic + EMA Stack
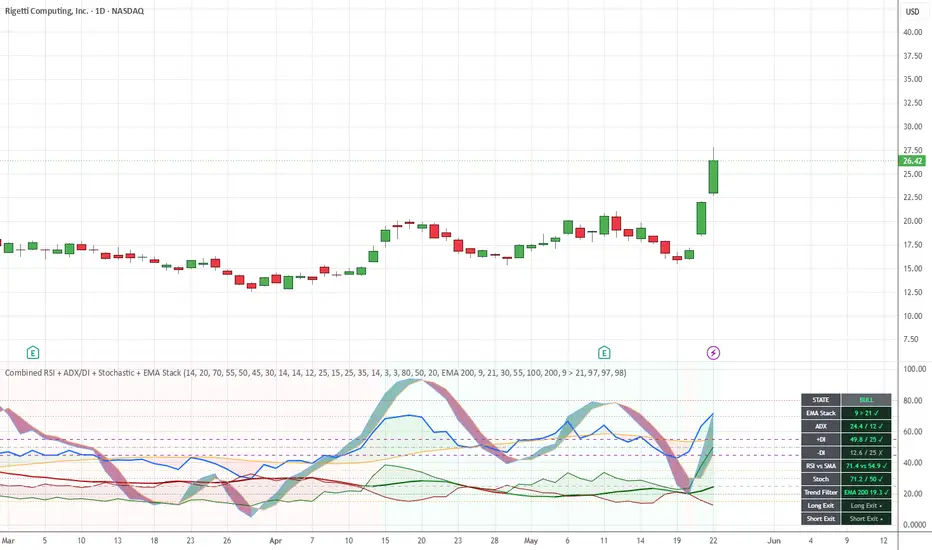
Short Description
A compact market structure indicator that combines EMA stack alignment, ADX/DI trend strength, RSI vs RSI SMA, Stochastic positioning, and an optional trend filter to present bull, bear, neutral, and no-trade conditions in a clear visual format.
Long Description
Combined RSI + ADX/DI + Stochastic + EMA Stack is a compact market-structure indicator designed to help traders evaluate directional alignment, trend strength, and momentum conditions in one place.
The indicator combines:
How it works
The main structural check is the selected EMA stack. The user can choose how strict that stack should be, from a simple 9 > 21 relationship to a broader multi-EMA sequence.
A bullish state requires:
the selected EMA stack to be aligned bullish
ADX above the no-trade threshold
+DI above the DI threshold
RSI above its SMA
Stochastic above 50
price above the selected trend filter when the filter is enabled
A bearish state requires:
the selected EMA stack to be aligned bearish
ADX above the no-trade threshold
-DI above the DI threshold
RSI below its SMA
Stochastic below 50
price below the selected trend filter when the filter is enabled
A no-trade state appears when ADX is below the defined threshold. This helps filter out weaker market conditions where trend strength may not be sufficient.
How to read the panel
The compact panel is designed to make the current condition easy to understand at a glance.
Each row shows the current value and whether that condition is currently supporting the active side.
Exit consideration
The script also includes stochastic-based exit context.
For long trades:
monitor when %K crosses below %D from an overbought area, typically above 80
this can indicate that bullish momentum is weakening
For short trades:
monitor when %K crosses above %D from an oversold area, typically below 20
this can indicate that bearish momentum is weakening
Suggested use
This indicator is best used as a trend-alignment and market-structure tool rather than as a standalone trading system. It can help traders:
Default settings are intended to provide a balanced starting point, while still allowing users to make the EMA stack and trend filter stricter or more flexible.
Notes
This indicator is intended for chart analysis and educational use. It should be used alongside broader market context, risk management, and personal trade planning.
Preferred time frame D or W chart for stocks.
Attribution
This script includes logic derived in part from “ADX Di+ Di- [Gu5]” by gu5tavo71.
Original source:
safecreative.org/work/2302153511401-adx-di-di-gu5-
© gu5tavo71 (Gustavo Cardelle)
License notice provided by the original author:
Attribution-NonCommercial 4.0 International (CC BY-NC 4.0)
creativecommons.org/licenses/by-nc-sa/4.0/
Summary of the author’s stated terms:
Share, copy and redistribute this script
Adapt, transform and build on this script
NonCommercial: You may not use the material for commercial purposes
Release Notes
Initial Release — Sam George
Combined RSI + ADX/DI + Stochastic + EMA Stack was created to make multi-factor trend alignment easier to read in a clear, compact format.
This first release includes:
This version is intended to provide a structured view of market condition, trend quality, and alignment across multiple components in one place.
A compact market structure indicator that combines EMA stack alignment, ADX/DI trend strength, RSI vs RSI SMA, Stochastic positioning, and an optional trend filter to present bull, bear, neutral, and no-trade conditions in a clear visual format.
Long Description
Combined RSI + ADX/DI + Stochastic + EMA Stack is a compact market-structure indicator designed to help traders evaluate directional alignment, trend strength, and momentum conditions in one place.
The indicator combines:
- EMA stack alignment
- ADX trend strength
- DI directional confirmation
- RSI relative to its SMA
- Stochastic position above or below the midline
- Optional trend filter using EMA 100 or EMA 200
How it works
The main structural check is the selected EMA stack. The user can choose how strict that stack should be, from a simple 9 > 21 relationship to a broader multi-EMA sequence.
A bullish state requires:
the selected EMA stack to be aligned bullish
ADX above the no-trade threshold
+DI above the DI threshold
RSI above its SMA
Stochastic above 50
price above the selected trend filter when the filter is enabled
A bearish state requires:
the selected EMA stack to be aligned bearish
ADX above the no-trade threshold
-DI above the DI threshold
RSI below its SMA
Stochastic below 50
price below the selected trend filter when the filter is enabled
A no-trade state appears when ADX is below the defined threshold. This helps filter out weaker market conditions where trend strength may not be sufficient.
How to read the panel
The compact panel is designed to make the current condition easy to understand at a glance.
- Green indicates bullish alignment
- Red indicates bearish alignment
- Amber indicates a no-trade condition because ADX is below threshold
- Neutral coloring indicates partial alignment, but not enough confirmation for a full bullish or bearish state
Each row shows the current value and whether that condition is currently supporting the active side.
Exit consideration
The script also includes stochastic-based exit context.
For long trades:
monitor when %K crosses below %D from an overbought area, typically above 80
this can indicate that bullish momentum is weakening
For short trades:
monitor when %K crosses above %D from an oversold area, typically below 20
this can indicate that bearish momentum is weakening
Suggested use
This indicator is best used as a trend-alignment and market-structure tool rather than as a standalone trading system. It can help traders:
- identify whether bullish or bearish conditions are structurally aligned
- avoid weaker market environments through the ADX no-trade filter
- confirm direction with DI, RSI, and Stochastic
- apply a broader directional bias using EMA 100 or EMA 200
- monitor stochastic crossover conditions as possible exit considerations
Default settings are intended to provide a balanced starting point, while still allowing users to make the EMA stack and trend filter stricter or more flexible.
Notes
This indicator is intended for chart analysis and educational use. It should be used alongside broader market context, risk management, and personal trade planning.
Preferred time frame D or W chart for stocks.
Attribution
This script includes logic derived in part from “ADX Di+ Di- [Gu5]” by gu5tavo71.
Original source:
safecreative.org/work/2302153511401-adx-di-di-gu5-
© gu5tavo71 (Gustavo Cardelle)
License notice provided by the original author:
Attribution-NonCommercial 4.0 International (CC BY-NC 4.0)
creativecommons.org/licenses/by-nc-sa/4.0/
Summary of the author’s stated terms:
Share, copy and redistribute this script
Adapt, transform and build on this script
NonCommercial: You may not use the material for commercial purposes
Release Notes
Initial Release — Sam George
Combined RSI + ADX/DI + Stochastic + EMA Stack was created to make multi-factor trend alignment easier to read in a clear, compact format.
This first release includes:
- Configurable EMA stack alignment for flexible trend structure analysis
- ADX no-trade filter to help avoid weaker trend conditions
- DI threshold confirmation for directional strength
- RSI vs RSI SMA for momentum bias
- Stochastic midline confirmation for additional trend alignment
- Optional Trend Filter using EMA 100 or EMA 200
- Compact state panel showing bull, bear, neutral, and no-trade conditions
- Stochastic-based exit context for long and short trade management
- Improved visual structure for faster decision support and easier interpretation
This version is intended to provide a structured view of market condition, trend quality, and alignment across multiple components in one place.
Skrypt open-source
W zgodzie z duchem TradingView twórca tego skryptu udostępnił go jako open-source, aby użytkownicy mogli przejrzeć i zweryfikować jego działanie. Ukłony dla autora. Korzystanie jest bezpłatne, jednak ponowna publikacja kodu podlega naszym Zasadom serwisu.

Wyłączenie odpowiedzialności
Informacje i publikacje nie stanowią i nie powinny być traktowane jako porady finansowe, inwestycyjne, tradingowe ani jakiekolwiek inne rekomendacje dostarczane lub zatwierdzone przez TradingView. Więcej informacji znajduje się w Warunkach użytkowania.
Skrypt open-source
W zgodzie z duchem TradingView twórca tego skryptu udostępnił go jako open-source, aby użytkownicy mogli przejrzeć i zweryfikować jego działanie. Ukłony dla autora. Korzystanie jest bezpłatne, jednak ponowna publikacja kodu podlega naszym Zasadom serwisu.
Wyłączenie odpowiedzialności
Informacje i publikacje nie stanowią i nie powinny być traktowane jako porady finansowe, inwestycyjne, tradingowe ani jakiekolwiek inne rekomendacje dostarczane lub zatwierdzone przez TradingView. Więcej informacji znajduje się w Warunkach użytkowania.