OPEN-SOURCE SCRIPT
DCA Accumulator
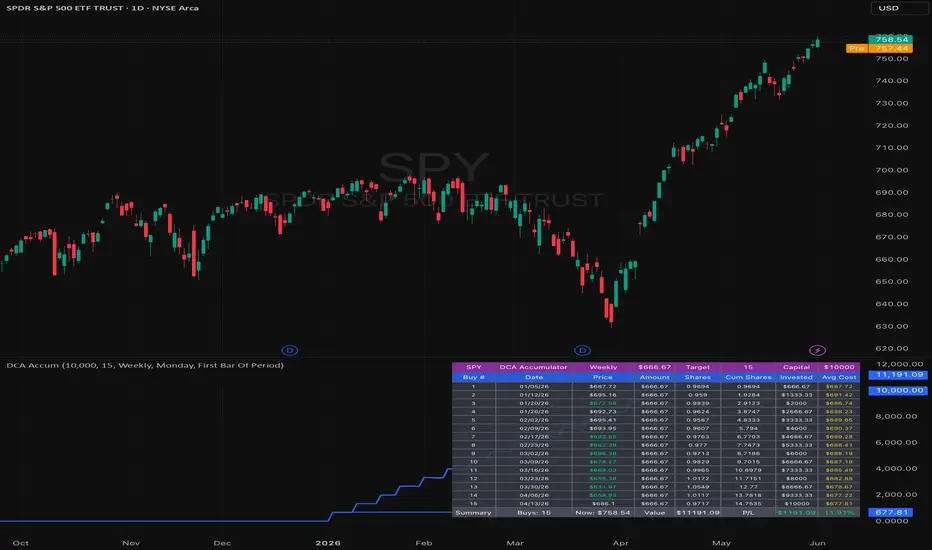
DCA Accumulator is a portfolio tracking indicator designed to help visualize a dollar-cost averaging plan on the currently selected chart symbol.
The script calculates scheduled purchases based on user-defined settings such as total capital, target number of buys, start date, buy frequency, and buy timing. The DCA amount is automatically calculated from the capital deployed divided by the target number of buys.
The indicator tracks:
* Number of completed buys
* Purchase date
* Purchase price
* Amount invested per buy
* Shares accumulated
* Total invested capital
* Average cost
* Current estimated position value
* Unrealized profit or loss
This tool is intended for planning, tracking, and educational analysis only. It does not generate buy or sell signals, does not predict future price movement, and does not guarantee any outcome. Values are based on chart data and the selected settings, so results may vary depending on symbol, timeframe, available history, and market conditions.
Past performance and historical chart behavior do not guarantee future results. This indicator should be used as one part of a broader research and risk management process, not as financial advice or a recommendation to buy, sell, or hold any asset.
The script calculates scheduled purchases based on user-defined settings such as total capital, target number of buys, start date, buy frequency, and buy timing. The DCA amount is automatically calculated from the capital deployed divided by the target number of buys.
The indicator tracks:
* Number of completed buys
* Purchase date
* Purchase price
* Amount invested per buy
* Shares accumulated
* Total invested capital
* Average cost
* Current estimated position value
* Unrealized profit or loss
This tool is intended for planning, tracking, and educational analysis only. It does not generate buy or sell signals, does not predict future price movement, and does not guarantee any outcome. Values are based on chart data and the selected settings, so results may vary depending on symbol, timeframe, available history, and market conditions.
Past performance and historical chart behavior do not guarantee future results. This indicator should be used as one part of a broader research and risk management process, not as financial advice or a recommendation to buy, sell, or hold any asset.
Skrypt open-source
W zgodzie z duchem TradingView twórca tego skryptu udostępnił go jako open-source, aby użytkownicy mogli przejrzeć i zweryfikować jego działanie. Ukłony dla autora. Korzystanie jest bezpłatne, jednak ponowna publikacja kodu podlega naszym Zasadom serwisu.

Independent market structure tools and educational chart analysis for learning and review only. Not financial advice.
Wyłączenie odpowiedzialności
Informacje i publikacje nie stanowią i nie powinny być traktowane jako porady finansowe, inwestycyjne, tradingowe ani jakiekolwiek inne rekomendacje dostarczane lub zatwierdzone przez TradingView. Więcej informacji znajduje się w Warunkach użytkowania.
Skrypt open-source
W zgodzie z duchem TradingView twórca tego skryptu udostępnił go jako open-source, aby użytkownicy mogli przejrzeć i zweryfikować jego działanie. Ukłony dla autora. Korzystanie jest bezpłatne, jednak ponowna publikacja kodu podlega naszym Zasadom serwisu.
Independent market structure tools and educational chart analysis for learning and review only. Not financial advice.
Wyłączenie odpowiedzialności
Informacje i publikacje nie stanowią i nie powinny być traktowane jako porady finansowe, inwestycyjne, tradingowe ani jakiekolwiek inne rekomendacje dostarczane lub zatwierdzone przez TradingView. Więcej informacji znajduje się w Warunkach użytkowania.